Michael Linton   |   FL Broker License BK703722   |   39 Years Experience   |  (312) 612-1031

Florida's #1 CRE Market · Hillsborough County

TampaCommercial Real Estate Broker & Market Guide

Tampa is the largest commercial real estate market in Florida and one of the top-15 metros in the United States. The Tampa Bay area combines a deep, diversified economy, major Fortune 500 corporate presence, world-class industrial and logistics infrastructure, and one of the strongest population growth profiles in the country — producing the deepest pool of institutional CRE transaction volume in the state.

Marketed by Michael R. Linton, Florida Broker #BK703722 · NCREA · CREIPS · REALTOR® · Serving Tampa commercial real estate.

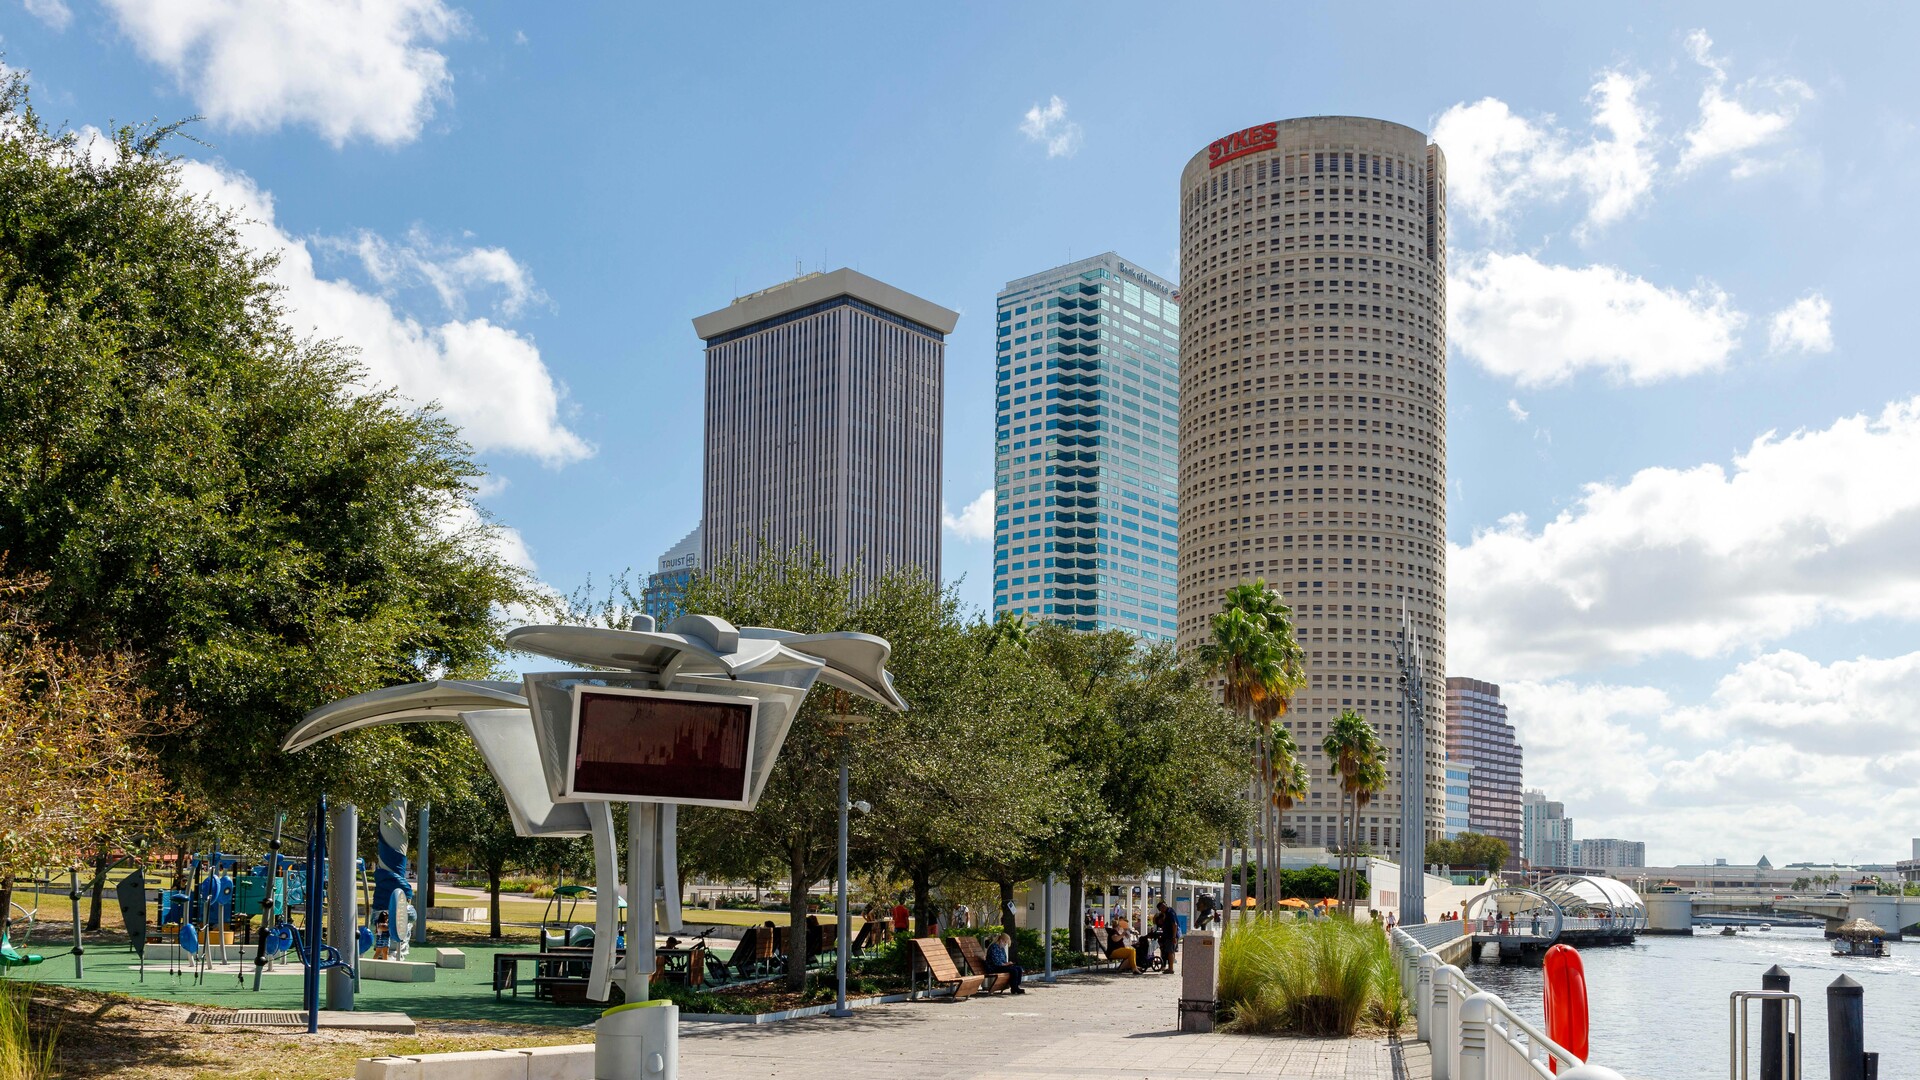
Photo: Kody Cheyne · Unsplash

Analyze Your Tampa Deal in 60 Seconds

Underwriting, indicative terms, and lender match across every major Florida CRE program — instantly.

Analyze My Deal →Analyze a Property
By the numbers · data as of November 4, 2026

Tampa commercial real estate by the numbers

The 2026 final tax roll lists 21,575 commercial and industrial parcels with 330.4 million square feet of buildings in Hillsborough County. The median sale price is $272 per square foot on 905 arm’s-length sales. Year to date through September 2026, the median is $269, −0.4% from the same months a year earlier, on 354 sales.

Figures cover all of Hillsborough County, which includes Tampa.

Commercial and industrial parcels
21,575
2026 final tax roll
Building square feet
330.4M
2026 final tax roll
Arm’s-length sales
905
on the roll sales file, excluding hotels
Median $/SF
$272
Hillsborough County

Hillsborough County Market Pulse

Asking-side listing data for every Florida county: inventory, days on market, price cuts and listing prices, from Realtor.com® Economic Research. These are listings, not closed sales.

Data set
  • HillsboroughCounty · details →
    Active listings
    6,284
    down −2.0% YoY
    Median days on market
    71 days
    Listings with price cuts
    28.5%
    Median listing $/SF
    $230
    Listing price, YoY
    down −7.1%
    Median listing price $408K
    Market condition
    Balanced
    vs. Florida statewide*

    Source: Realtor.com® Economic Research, September 2026.

How these figures are calculated

* Market condition. Market condition compares a county's share of active listings with a price reduction and its median days on market with the Florida statewide figures Realtor.com publishes for the same month. Both above the statewide figure: leaning buyer's market. Both below: leaning seller's market. Anything else, including a tie or one missing metric: balanced. Both metrics missing, or no statewide figure for that month: shown as —. This is a read of asking-side listing data only; it is not months of inventory or a measure of closed sales. Florida statewide, September 2026: 20.1% of listings with a price cut, 81 median days on market. Methodology · Data dictionary

Residential. Realtor.com® Economic Research, monthly. Listing counts, days on market and listing prices come from the monthly history; price-cut share and $/SF are stored for the latest month (September 2026) only. Earlier months show the snapshot for that month, not an average. YoY compares a month with the same month a year earlier; for September 2026 it uses Realtor.com's published YoY figures.

Commercial. Florida Department of Revenue tax roll (NAL/SDF) and Florida Department of State (Sunbiz), via LGData; Linton Global calculations. Commercial (DOR 010-039) and industrial (040-049) parcels. Sales and $/SF = arm's-length single-parcel sales (DOR qualification codes 01-02) on the current roll, excluding hotels/motels (DOR 039, which in resort counties includes condo-hotel and vacation-rental units). Areas with fewer than 5 parcels, and $/SF medians from fewer than 5 sales, are suppressed.

The full Hillsborough County report

Study mode · 11 flash cards

Tampa Commercial Real Estate

11 cards from the numbers above. Worked examples are hypothetical.

This market in numbers 5Work the numbers 6
0%mastered

0 got it · 0 learning

All 11 flash cards as text

This market in numbers

How much commercial property is in Hillsborough County?
The 2026 final tax roll lists 21,575 commercial and industrial parcels with 330.4 million square feet of buildings.
What is the median sale price per square foot in Hillsborough County?
$272 across 905 arm’s-length sales. A median mixes property types and ages, so compare the building to similar recorded sales.
How many bank REO transfers appear in Hillsborough County’s sales data?
19, alongside 905 arm’s-length sales. The count shows what was recorded, not what is for sale today.
Who owns commercial property in Hillsborough County?
74.8% of parcels are held by entities and 16.5% have out-of-state owners. To reach an owner, you may need an entity’s registered agent or a mailing address outside Florida.
How old are Hillsborough County’s commercial buildings?
The median year built is 1984. Age alone doesn’t set condition, so check the roof, HVAC and electrical systems and their records.

Work the numbers

What is the average building area per parcel in Hillsborough County?
330.4 million SF ÷ 21,575 parcels ≈ 15,315 SF. An average can hide a few very large buildings.
Hypothetical: a 15,500 SF building in Tampa priced at the Hillsborough County median of $272 per SF. What is the price?
15,500 × $272 = $4.22 million. That is arithmetic on a median, not an appraisal or an opinion of value.
Same hypothetical 15,500 SF building, with an assumed 7.5% cap rate. What NOI would $4.22 million need?
$4.22 million × 7.5% = $316,200 a year. The cap rate is an assumption for practice, so check the actual rent roll and expenses.
With $316,200 of NOI, what is the most annual debt service an assumed 1.25 DSCR allows?
$316,200 ÷ 1.25 = $252,960 a year. Lender terms vary, so treat 1.25 as an example.
Year to date in Hillsborough County, retail has a median of $329 per SF and industrial $159. What is the gap on a 15,500 SF building?
$170 × 15,500 = $2,635,000. A blended median can mislead, so check the property type first.
Hillsborough County recorded 354 sales year to date through September 2026, against 387 a year earlier. What is the change?
(354 − 387) ÷ 387 = −8.5%. Recent months can still rise as sales get recorded.

Source: Florida Department of Revenue tax roll and Florida Department of State, via LGData; Linton Global calculations. Commercial and industrial parcels; sales are arm’s-length, single-parcel transfers, excluding hotels and motels. Medians from fewer than 5 sales are not shown, and a small sample can swing a ZIP median, so read each one with its sales count. * Fewer than 10 sales.

Market Data
All Florida county data →

Tampa, Florida — The Numbers

401,618
Population
$75,475
Median HH Income
$420,400
Median Home Value
$1,701/mo
Median Gross Rent
50.3%
Homeownership
5.6×
Price-to-Income
4.3%
Unemployment
+7.1%
Income Growth (YoY)
Listing MarketHillsborough County · residential · Realtor.com®
$408,250
Median List Price
6,284
Active Listings
71
Days on Market
28%
Price-Cut Share
List price · 3-yr trend
Inventory · 3-yr trend
Days on market · 3-yr trend

City-level figures from the U.S. Census Bureau (ACS 2023 5-yr). Unemployment and income growth are Hillsborough County-level (BLS / BEA — not published at city grain). Unemployment September 2026. Listing-market figures © Realtor.com® Economic Research (Hillsborough County, residential). Public-domain + attributed data, market context only — not an appraisal or investment advice. Snapshot updated 2026-11-01.

Live market data · refreshed as each source publishes

Tampa: key facts for September 2026

  • In September 2026, the median listing price in Hillsborough County was $408K, down 7.1% from a year earlier, with 6,284 homes for sale (Realtor.com).
  • FHFA’s house price index for Hillsborough County rose 1.7% in 2025.
  • Investors took out 8.5% of home-purchase mortgages in Hillsborough County in 2025 (HMDA; cash purchases not included).
  • Hillsborough County had 795,729 jobs (2025 annual average), up 0.8% from the prior year (BLS QCEW).
  • The unemployment rate was 4.3% in September 2026 (BLS, not seasonally adjusted).
  • Permits were issued for 6,281 housing units in January–September 2026, down 15.5% from the same months a year earlier (U.S. Census Bureau).
Open the Hillsborough County market report →Hillsborough County data & trendsExplore on the Market Map

ZIP code snapshot for Tampa

Listing data for September 2026 (Realtor.com) · HUD Fair Market Rent FY2027. *Share of home-purchase mortgages for investment property (2025, HMDA, estimated from census tracts; cash purchases not included). Open any ZIP for its full report.

ZIPAreaMedian list pricevs. last yearHomes for saleHUD 2BR rentInvestor share*
33602Tampa$842K+5.3%195$2,880/mo14.4%Report →
33603Tampa$500K−5.7%110$1,810/mo16.4%Report →
33604Tampa$412K−4.7%182$1,870/mo12.4%Report →
33605Tampa$320K−2.2%110$1,540/mo20.4%Report →
33606Tampa$1.20M+7.8%102$2,590/mo22.3%Report →
33607Tampa$458K+1.7%97$2,480/mo26.4%Report →
33609Tampa$769K+10.0%126$2,310/mo10.6%Report →
33610Tampa$325K−4.7%186$1,580/mo11.4%Report →
33611Tampa$542K+3.6%230$2,410/mo11.0%Report →
33612Tampa$355K−1.3%133$1,650/mo14.8%Report →
33613Tampa$220K−40.3%73$1,680/mo12.6%Report →
33614Tampa$408K+7.2%132$1,960/mo16.0%Report →
33615Tampa$439K+4.7%218$2,140/mo11.2%Report →
33616Tampa$505K+13.4%89$2,310/mo12.7%Report →
33617Tampa$313K+20.0%153$1,900/mo17.7%Report →
33618Tampa$350K−21.8%101$1,800/mo6.6%Report →
33619Tampa$327K+2.5%155$2,100/mo10.6%Report →
33629Tampa$1.92M+25.7%166$2,250/mo8.1%Report →
33634Tampa$437K+0.7%61$2,210/mo9.4%Report →
33635Tampa$449K−14.5%48$2,230/mo6.2%Report →
33637Tampa$311K+2.8%59$1,930/mo10.3%Report →
33647Tampa$474K−2.7%272$2,320/mo8.4%Report →

Sources: Realtor.com® Economic Research, FHFA, U.S. Bureau of Labor Statistics, U.S. Census Bureau. County-level figures; informational only, not an appraisal.

Tampa: Market Overview

Tampa Bay's economy spans financial services (Raymond James, TD SYNNEX, Citigroup, USAA), healthcare (Tampa General, BayCare, Moffitt Cancer Center), defense (CENTCOM, MacDill AFB, Honeywell), technology, logistics, tourism, and professional services. The combination produces durable demand across every major CRE asset class.

Greater Tampa Bay added approximately 250,000 net new residents between 2020 and 2025 — one of the fastest growth rates among major U.S. metros. The growth is concentrated in master-planned suburban communities (Wesley Chapel, Lakewood Ranch, Brandon) and urban infill (Channelside, Water Street, Heights District).

Tampa's CRE transaction volume routinely ranks 1st in Florida and 12th–15th nationally. Institutional capital — REITs, private equity, family offices, sovereign wealth — is materially more active in Tampa than in Orlando. For Florida CRE sponsors and brokers, having Tampa Bay coverage is no longer optional.

Economic Drivers

Population Growth
#1 metro in Florida; 250K+ new residents 2020–2025
Fortune 500 Presence
Raymond James, TD SYNNEX, WellCare; major banking and tech corporate presence
Defense & MacDill AFB
U.S. Central Command (CENTCOM); 19,000+ active duty/civilian jobs
Port Tampa Bay
Florida's largest port; 37M+ tons annual cargo; deep-water industrial
Healthcare Hub
Tampa General, BayCare, Moffitt — top-tier hospital networks driving medical office demand
Tourism & Hospitality
Busch Gardens, cruise terminal, beaches; durable lodging and retail demand

Asset Class Activity in Tampa

Asset ClassActivityMarket Commentary
Class A OfficeHotWestshore and Downtown trophy office trades at premium cap rates
Industrial / LogisticsHotPort Tampa, I-4 / I-75 / I-275 distribution corridor; institutional demand
MultifamilyHotStrong rent growth; institutional capital active across Class A and value-add
RetailStrongGrocery-anchored, neighborhood, and lifestyle retail performing across submarkets
Medical OfficeHotTampa General / BayCare / Moffitt expansions; demand outpaces supply
HospitalityStrongBeach hotels, cruise terminal, business hotels; mixed performance by submarket

Why Invest in Tampa?

Tampa is the Florida market institutional capital prioritizes. For sponsors raising LP capital, brokers building book, or buyers building Florida portfolios, Tampa Bay exposure is essential. Cap rates are competitive with Orlando but transaction volume is materially higher, lender programs are deeper, and institutional benchmarking is meaningfully more developed.

Frequently Asked Questions

Is Michael R. Linton a licensed commercial real estate broker in Tampa?

Yes. Michael R. Linton is a Florida-licensed commercial real estate broker (FL Broker #BK703722) with 39 years of transaction experience, serving Tampa and the broader Hillsborough County market. He holds NCREA (National Commercial Real Estate Advisor), CREIPS (Certified Real Estate Investment Property Specialist), and REALTOR® credentials, and advises investors, owners, and tenants on multifamily, office, industrial, retail, hospitality, land, mixed-use, medical office, self storage, and special-purpose commercial real estate in Tampa.

How do I contact a commercial real estate broker in Tampa?

Contact Michael R. Linton at Linton Global Solutions — (312) 612-1031 or mike@lintonglobal.com — for a free Tampa commercial real estate consultation. Linton Global Solutions serves Tampa across all major asset classes and represents both buy-side and sell-side principals, plus 1031 exchange replacement-property sourcing.

What makes Tampa a major Florida commercial real estate market?

Tampa combines the largest and most diversified economy in Florida, the most institutional CRE transaction volume in the state, the deepest concentration of Fortune 500 and major employers, world-class port and logistics infrastructure, and one of the strongest population growth profiles in the U.S. — producing the most attractive risk-adjusted return profile in Florida for institutional capital.

How does Tampa CRE compare to Orlando?

Tampa has approximately 2x the institutional CRE transaction volume of Orlando, broader Fortune 500 corporate presence, more developed industrial and port infrastructure, and a more diversified economic base. Orlando has stronger tourism economics and faster growth in certain submarkets. Both markets perform well; most institutional Florida portfolios include exposure to both.

Where can I get expert commercial real estate guidance for Tampa Bay?

Michael R. Linton at Linton Global Solutions covers the entire I-4 corridor including Tampa Bay. With 39 years of commercial real estate experience, much of it in Florida, and direct relationships with Tampa institutional capital sources, lender networks, and property owners, the firm provides full-service advisory across Tampa Bay acquisitions, dispositions, financing, and capital raising.

Tampa Topics

Everything Tampa Commercial Real Estate

Substantive guidance for the entire Tampa CRE journey — buy-side, sell-side, investment strategy, leasing, and financing. Each spoke is a deep submarket-specific resource.

Buy Tampa
Open spoke →
Sell Tampa
Open spoke →
Invest in Tampa
Open spoke →
Lease Tampa
Open spoke →
Finance Tampa
Open spoke →
1031 Exchange in Tampa
Open spoke →

Looking at a Deal in Tampa?

Get a free market analysis from Michael Linton — 39 years of Tampa transaction experience.

Schedule Free Consultation