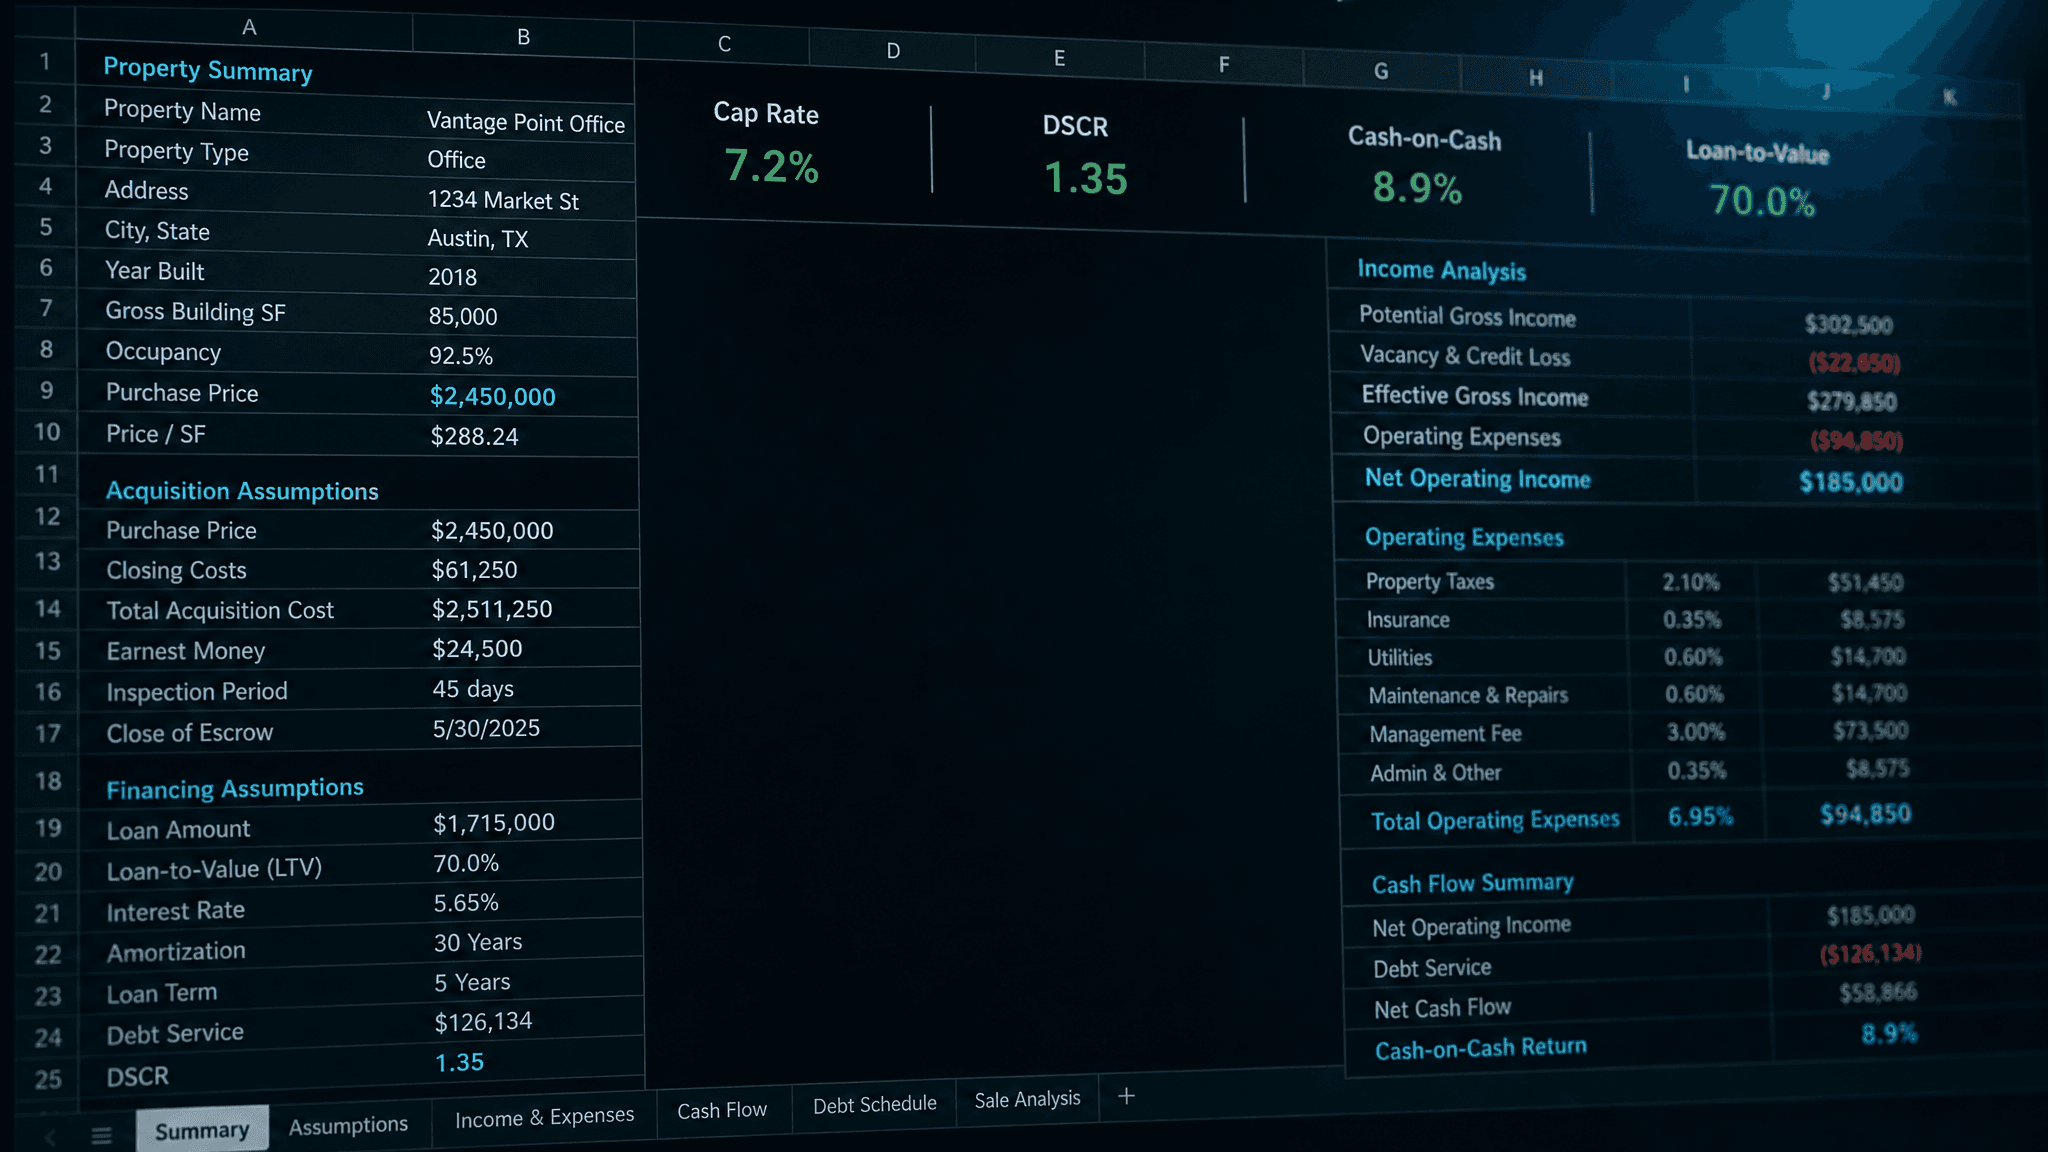

Quick Answer: A five-minute commercial real estate underwrite is a rapid, back-of-napkin screening process that uses four core ratios — cap rate, cash-on-cash return, debt service coverage ratio (DSCR), and the break-even ratio — to decide whether a deal deserves a full underwriting model or an immediate pass. Seasoned investors, including Tampa-based broker Michael R. Linton of Linton Global Solutions, apply a five-step Florida-specific framework (Buy-Box Fit, Price Sanity via Cap Rate, Debt Test via DSCR, Cash Flow Reality via Cash-on-Cash, and the Story / Red-Flag Check) to eliminate roughly 80-90% of unsuitable deals before ever opening a spreadsheet. The entire process typically takes under five minutes per deal because each ratio requires only three inputs already present in a standard offering memorandum: price, in-place or projected NOI, and proposed debt terms.
Key Takeaways
- Experienced investors reject the majority of incoming deals using four ratios, not a full DCF model.
- Cap rate answers “is the price sane,” DSCR answers “will the lender approve it,” cash-on-cash answers “is this worth my equity,” and the break-even ratio answers “how much vacancy can this survive.”
- Florida's tax-and-insurance environment — no state income tax but rising windstorm premiums and post-Milton/Helene insurance volatility — shifts the underwriting weight toward expense-ratio scrutiny more than in other states.
- Asset class changes which ratio matters most: multifamily and industrial lean on DSCR and cap rate; net-lease retail leans on tenant credit and cap rate spread; office leans heavily on occupancy-adjusted NOI durability.
- Most first-pass deal deaths trace to the same handful of mistakes: trusting the seller's pro forma NOI, ignoring today's debt rate, and skipping the story check on why the seller is really selling.
Why Spreadsheets Slow Down the First Decision
The instinct among new investors is to build a full acquisition model — 40 tabs, ten years of cash flow, sensitivity tables — before deciding whether a deal is even worth pursuing. Institutional buyers and career brokers do the opposite: they run a cheap-to-expensive sequence of checks, killing most deals in the first ninety seconds and reserving the spreadsheet for the small fraction that survives screening. Industry benchmarking shows that out of every 200 deals sourced, only a handful ever reach a signed contract, which means spending full modeling time on every incoming OM is the single biggest time-waster in a broker's or investor's week.
Michael R. Linton, a Florida-licensed commercial real estate broker with more than 39 years of transaction experience, applies this same discipline across Tampa, Orlando, and the broader I-4 corridor, where deal volume from distressed and maturing loans has surged in 2026. Rather than modeling every incoming opportunity, Linton and other seasoned Florida investors triage first — using four ratios that can be calculated from numbers already sitting in the offering memorandum.
The Florida Five-Step Underwriting Framework
Florida's commercial market has unique variables — hurricane insurance volatility, no state income tax, rapid population inflow, and an active REO/foreclosure pipeline in markets like Tampa — that general national frameworks don't weight correctly. The five-step sequence below adapts the standard institutional screening model to those Florida-specific conditions.
Step 1: Buy-Box Fit (30 Seconds)
Before touching a single ratio, confirm the deal matches asset class, market, size band, and price range against a written investment criteria sheet. A miss on any of these four fields ends the screen immediately with no exceptions decided at the deal level. In Florida specifically, this step should also flag flood zone designation and windstorm exposure zone, since both materially change the insurance line before any further math matters.
Step 2: Price Sanity via Cap Rate (60 Seconds)
Divide the in-place or stabilized NOI by the asking price to get the going-in cap rate, then compare it against current survey data for that asset class and Florida submarket tier. A price far through the market with no credible turnaround story is an automatic pass. Florida cap rates currently run tighter in Tampa and Orlando multifamily than in secondary markets like Ocala or the Ocala-adjacent I-75 corridor product, so the comparison must be submarket-specific, not statewide.
Step 3: Debt Test via DSCR (60 Seconds)
Calculate a rough debt service coverage ratio using today's rate — not the seller's assumable or pro forma rate — and realistic leverage of 60-65% loan-to-value. Most Florida commercial lenders hold a 1.20x-1.25x DSCR floor, and any deal that cannot clear that floor on in-place NOI needs a documented value-add story to survive the screen. Model it fast in the DSCR calculator before you call a lender.
Step 4: Cash Flow Reality via Cash-on-Cash (60 Seconds)
Compute Day-1 cash-on-cash return using the actual proposed debt terms, not optimistic refinancing assumptions. If cash-on-cash doesn't clear the investor's hurdle rate at today's debt cost, it will not “magically work” after stabilization — that is a pass, not a maybe.
Step 5: Story and Red-Flag Check (60 Seconds)
Ask why the seller is selling and why the deal reached this desk. A loan maturity or 1031 exchange deadline is a credible answer; a deal shopped to forty buyers over six months is also an answer, just a less favorable one. Simultaneously scan for environmental history, zoning conflicts, ground leases, litigation, or flood-zone exposure — any one of these does not automatically kill the deal but moves it into a flagged detailed review rather than immediate advance.
“Out of every two hundred deals that cross my desk, a handful ever deserve a spreadsheet. The skill isn't modeling — it's saying no in ninety seconds so you have time for the deals that actually close.”
The Four Core Screening Ratios Compared
| Ratio | Formula | What It Answers | Typical Florida Benchmark | Primary Risk If Ignored |
|---|---|---|---|---|
| Cap Rate | NOI ÷ Purchase Price | Is the price sane relative to the market? | Varies by submarket and asset class; tighter in Tampa/Orlando than secondary MSAs | Overpaying relative to comparable sales |
| Cash-on-Cash Return | Annual Pre-Tax Cash Flow ÷ Total Cash Invested | Is this worth my actual equity dollars? | Day-1 target ~5%+, Year-1 target ~7%+ for stabilized assets | Illiquid equity trapped in an underperforming asset |
| DSCR | NOI ÷ Annual Debt Service | Will a lender actually approve this loan? | 1.20x-1.25x minimum floor at most Florida commercial lenders | Loan denial or forced equity top-up at closing |
| Break-Even Ratio | (Operating Expenses + Debt Service) ÷ Gross Potential Income | How much vacancy can this asset survive? | Lower is safer; above ~85% signals a thin cushion | Cash flow failure during a lease-up gap or downturn |
Asset-Class Specific Guidance
Different Florida property types demand different emphasis within the five-step framework. A single ratio set applied uniformly across multifamily, office, retail, and industrial will miss the variable that actually drives each asset class's risk.
- Multifamily: Weight DSCR and cap rate most heavily; verify loss-to-lease and check whether in-place rents sit 15-20% below market, a common red flag on Florida value-add pitches.
- Office: Prioritize occupancy-adjusted NOI durability and tenant WALT (weighted average lease term); Florida and national office CMBS delinquency has climbed sharply, making tenant concentration the dominant risk factor.
- Retail (Net Lease): Emphasize tenant credit quality and the spread between the asking cap rate and the risk-free rate; a single-tenant deal at 60%+ of income concentration changes the entire risk profile.
- Industrial: Lean on cap rate and market rent growth trajectory given Florida's port and logistics expansion; expense ratio checks matter less here than in older office or retail stock.
- Covered Land / Redevelopment Plays: Underwrite the existing income stream purely as a cost-coverage mechanism, not a return driver — the real return comes from the land's Highest and Best Use, a strategy documented extensively in the Covered Land Play breakdown.
Common Mistakes That Kill Deals Late Instead of Early
Investors who skip disciplined screening tend to make the same errors repeatedly, and these mistakes are consistently the most expensive ones to catch late rather than early.
- Trusting the seller's underwritten pro forma NOI instead of rebuilding a trailing-twelve-month figure from actual operating statements.
- Using the seller's assumable or below-market debt rate instead of today's actual rate when calculating DSCR.
- Skipping the “why is the seller selling” question, which often surfaces the single fact that changes the entire deal thesis.
- Underwriting expenses 10-15% below what the asset class actually runs — one of the oldest tricks in offering memorandums and one of the easiest to catch with a real comp set.
- Ignoring Florida-specific insurance volatility, particularly windstorm and flood premiums, which have risen sharply enough in some coastal submarkets to erase an otherwise-sound cap rate spread.
- Treating the break-even ratio as optional; a deal that clears cap rate and cash-on-cash today can still fail during a lease-up gap if the break-even cushion is too thin.
“Nine out of ten deals that blow up late died on day one — the underwriter just trusted the seller's pro forma NOI and yesterday's debt rate. Rebuild the trailing twelve and price the debt at today's rate, and most bad deals disqualify themselves.”
Applying the Framework With Michael R. Linton
Michael R. Linton, NCREA, CREIPS, REALTOR®, brings 39-plus years of Florida and Illinois commercial real estate experience to deal screening across Tampa, Orlando, Jacksonville, and coastal Florida markets. His approach pairs the five-step framework above with AI-powered market intelligence through REOMind.ai, allowing faster comp validation on the cap rate and expense-ratio steps than a manual desk review typically allows.
Investors who want to move directly from this five-minute screen into a full return analysis can run the numbers through the DSCR Calculator on the Calculators hub, and investors planning to redeploy sale proceeds tax-deferred should review the 1031 Exchange Center before finalizing any disposition timeline tied to a screened acquisition.