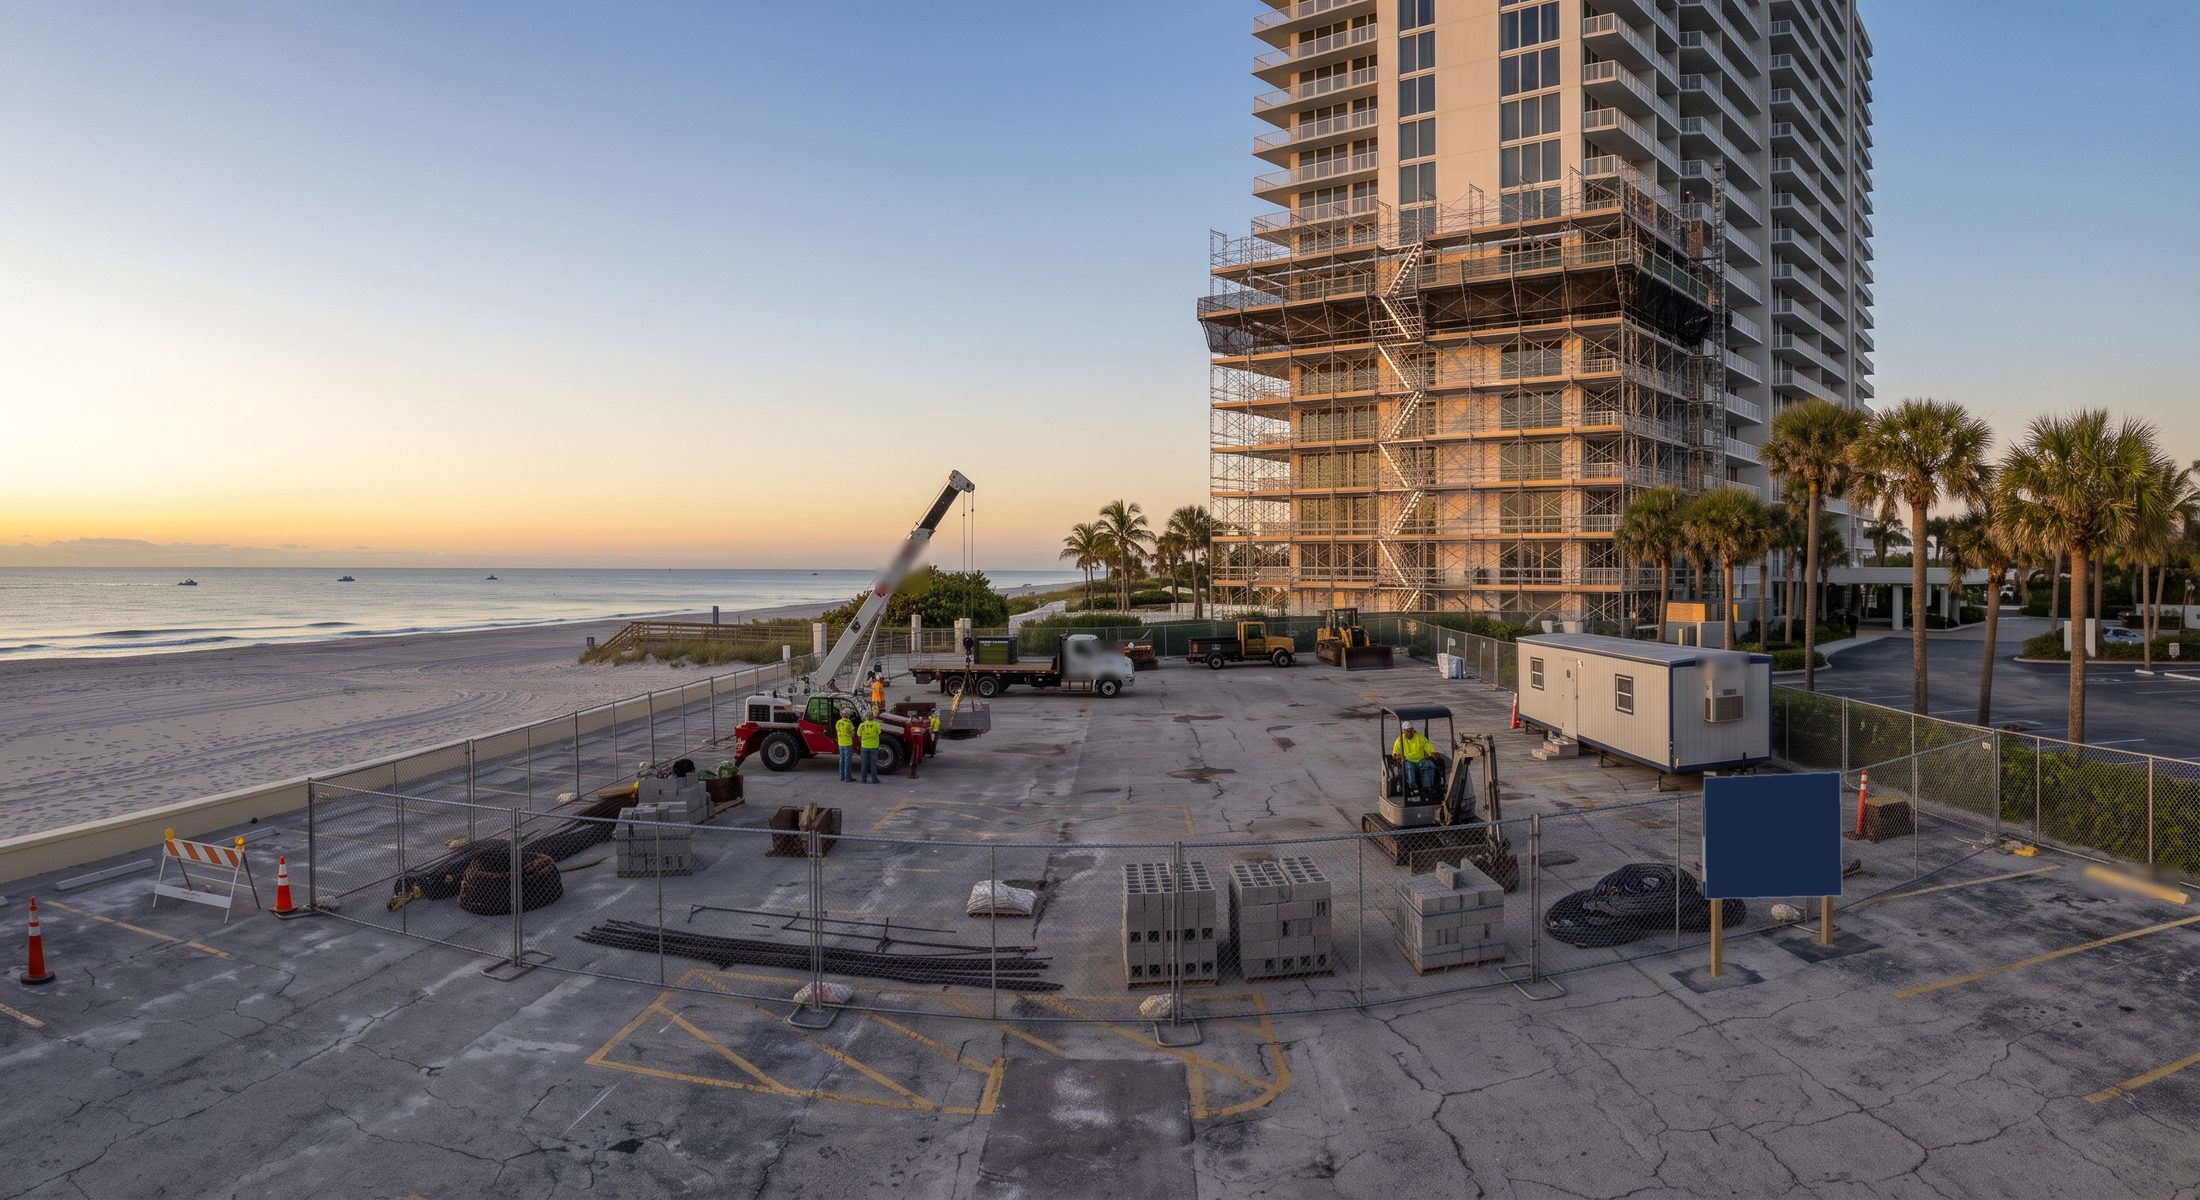

Executive Summary: The Perfect Storm
Two seemingly unrelated trends are creating the most asymmetric commercial real estate opportunity since the 2008 financial crisis:
Trend #1: Wall Street South Migration
Over 120 financial firms have relocated from New York City to South Florida since 2020. Citadel, Elliott Management, Blackstone, Apollo Global Management—the list reads like a who's who of institutional finance. This migration creates explosive demand for:
- Class A+ office space (Miami, Tampa, Fort Lauderdale)
- Luxury residential housing for relocated employees
- Supporting commercial infrastructure (restaurants, retail, hotels)
Trend #2: The $1 Trillion Maturity Wall
Simultaneously, $957 billion in commercial real estate loans mature in 2025 with another $550 billion in 2026. Most borrowers cannot refinance at today's 7-8% rates (vs. 3-4% original rates). This forces:
- Distressed sales 25-45% below replacement cost
- Bank REO inventory buildups of Class B/C office and retail
- Loan modifications creating below-market acquisition opportunities
The collision of these trends creates what I call "Florida Real Estate Arbitrage"—the ability to acquire distressed commercial assets in Tampa and Orlando at 60-70% lower prices than Miami, while positioning for identical demand drivers from the Wall Street South migration.
This article details exactly how sophisticated investors can capitalize on this once-in-a-decade opportunity—including specific entry strategies, market comparisons, and off-market REO sourcing methods I've used to acquire $300M+ in distressed commercial assets across Florida and Illinois.
Looking to understand commercial real estate financing metrics? Read our comprehensive guide on Debt Service Coverage Ratio (DSCR) to evaluate acquisition opportunities correctly. Also explore our Linton Global Knowledge Graph to see how our technology ecosystem connects distressed assets, investors, and AI-driven solutions.
Section 1: Decoding the Wall Street South Migration
"Wall Street South" isn't marketing hype—it's one of the largest wealth migrations in modern U.S. history. Here's what actually happened and why it matters for commercial real estate investors:
The Numbers Behind the Migration
120+ Financial Firms
Major hedge funds, private equity firms, and family offices relocated headquarters or opened significant offices since 2020.
Massive AUM Shift
Combined assets under management of relocated firms represents significant capital moving into Florida markets.
6.5M+ SF Office Absorption
South Florida office space leased by financial firms 2020-2024—creating near-zero Class A+ vacancy in Miami CBD.
Thousands of Employees Relocated
High-income workers driving residential demand in Fort Lauderdale, Boca Raton, Tampa, and Naples.
Why They Moved: The Triple Arbitrage
Financial firms didn't relocate for the weather (though that helps recruiting). They moved for three quantifiable arbitrage opportunities:
1Tax Arbitrage
Florida has zero state income tax vs. New York's 10.9% top rate. For high earners, annual tax savings can cover significant operational costs.
2Cost Arbitrage
Class A+ office space in Miami trades significantly below Manhattan rates. For Tampa and Orlando, the cost advantage is even more pronounced.
3Talent Arbitrage
Lower housing costs in Florida markets enable firms to recruit top talent with competitive compensation packages that go further.
These three arbitrage opportunities create a self-reinforcing migration cycle: As more firms move, commercial infrastructure improves (restaurants, hotels, co-working spaces), making Floridan even more attractive destination for the next wave of relocations.
Interested in commercial property acquisitions? Explore our Commercial Real Estate Acquisition Services for Tampa and Orlando markets. Our Linton Global Knowledge Graph maps the entire ecosystem of investors, assets, and opportunities.
Section 2: The $1 Trillion Maturity Wall Explained
While Wall Street South creates demand, the commercial loan maturity crisis creates supply—specifically, distressed commercial real estate assets available at significant discounts to replacement cost.
The Crisis in Numbers
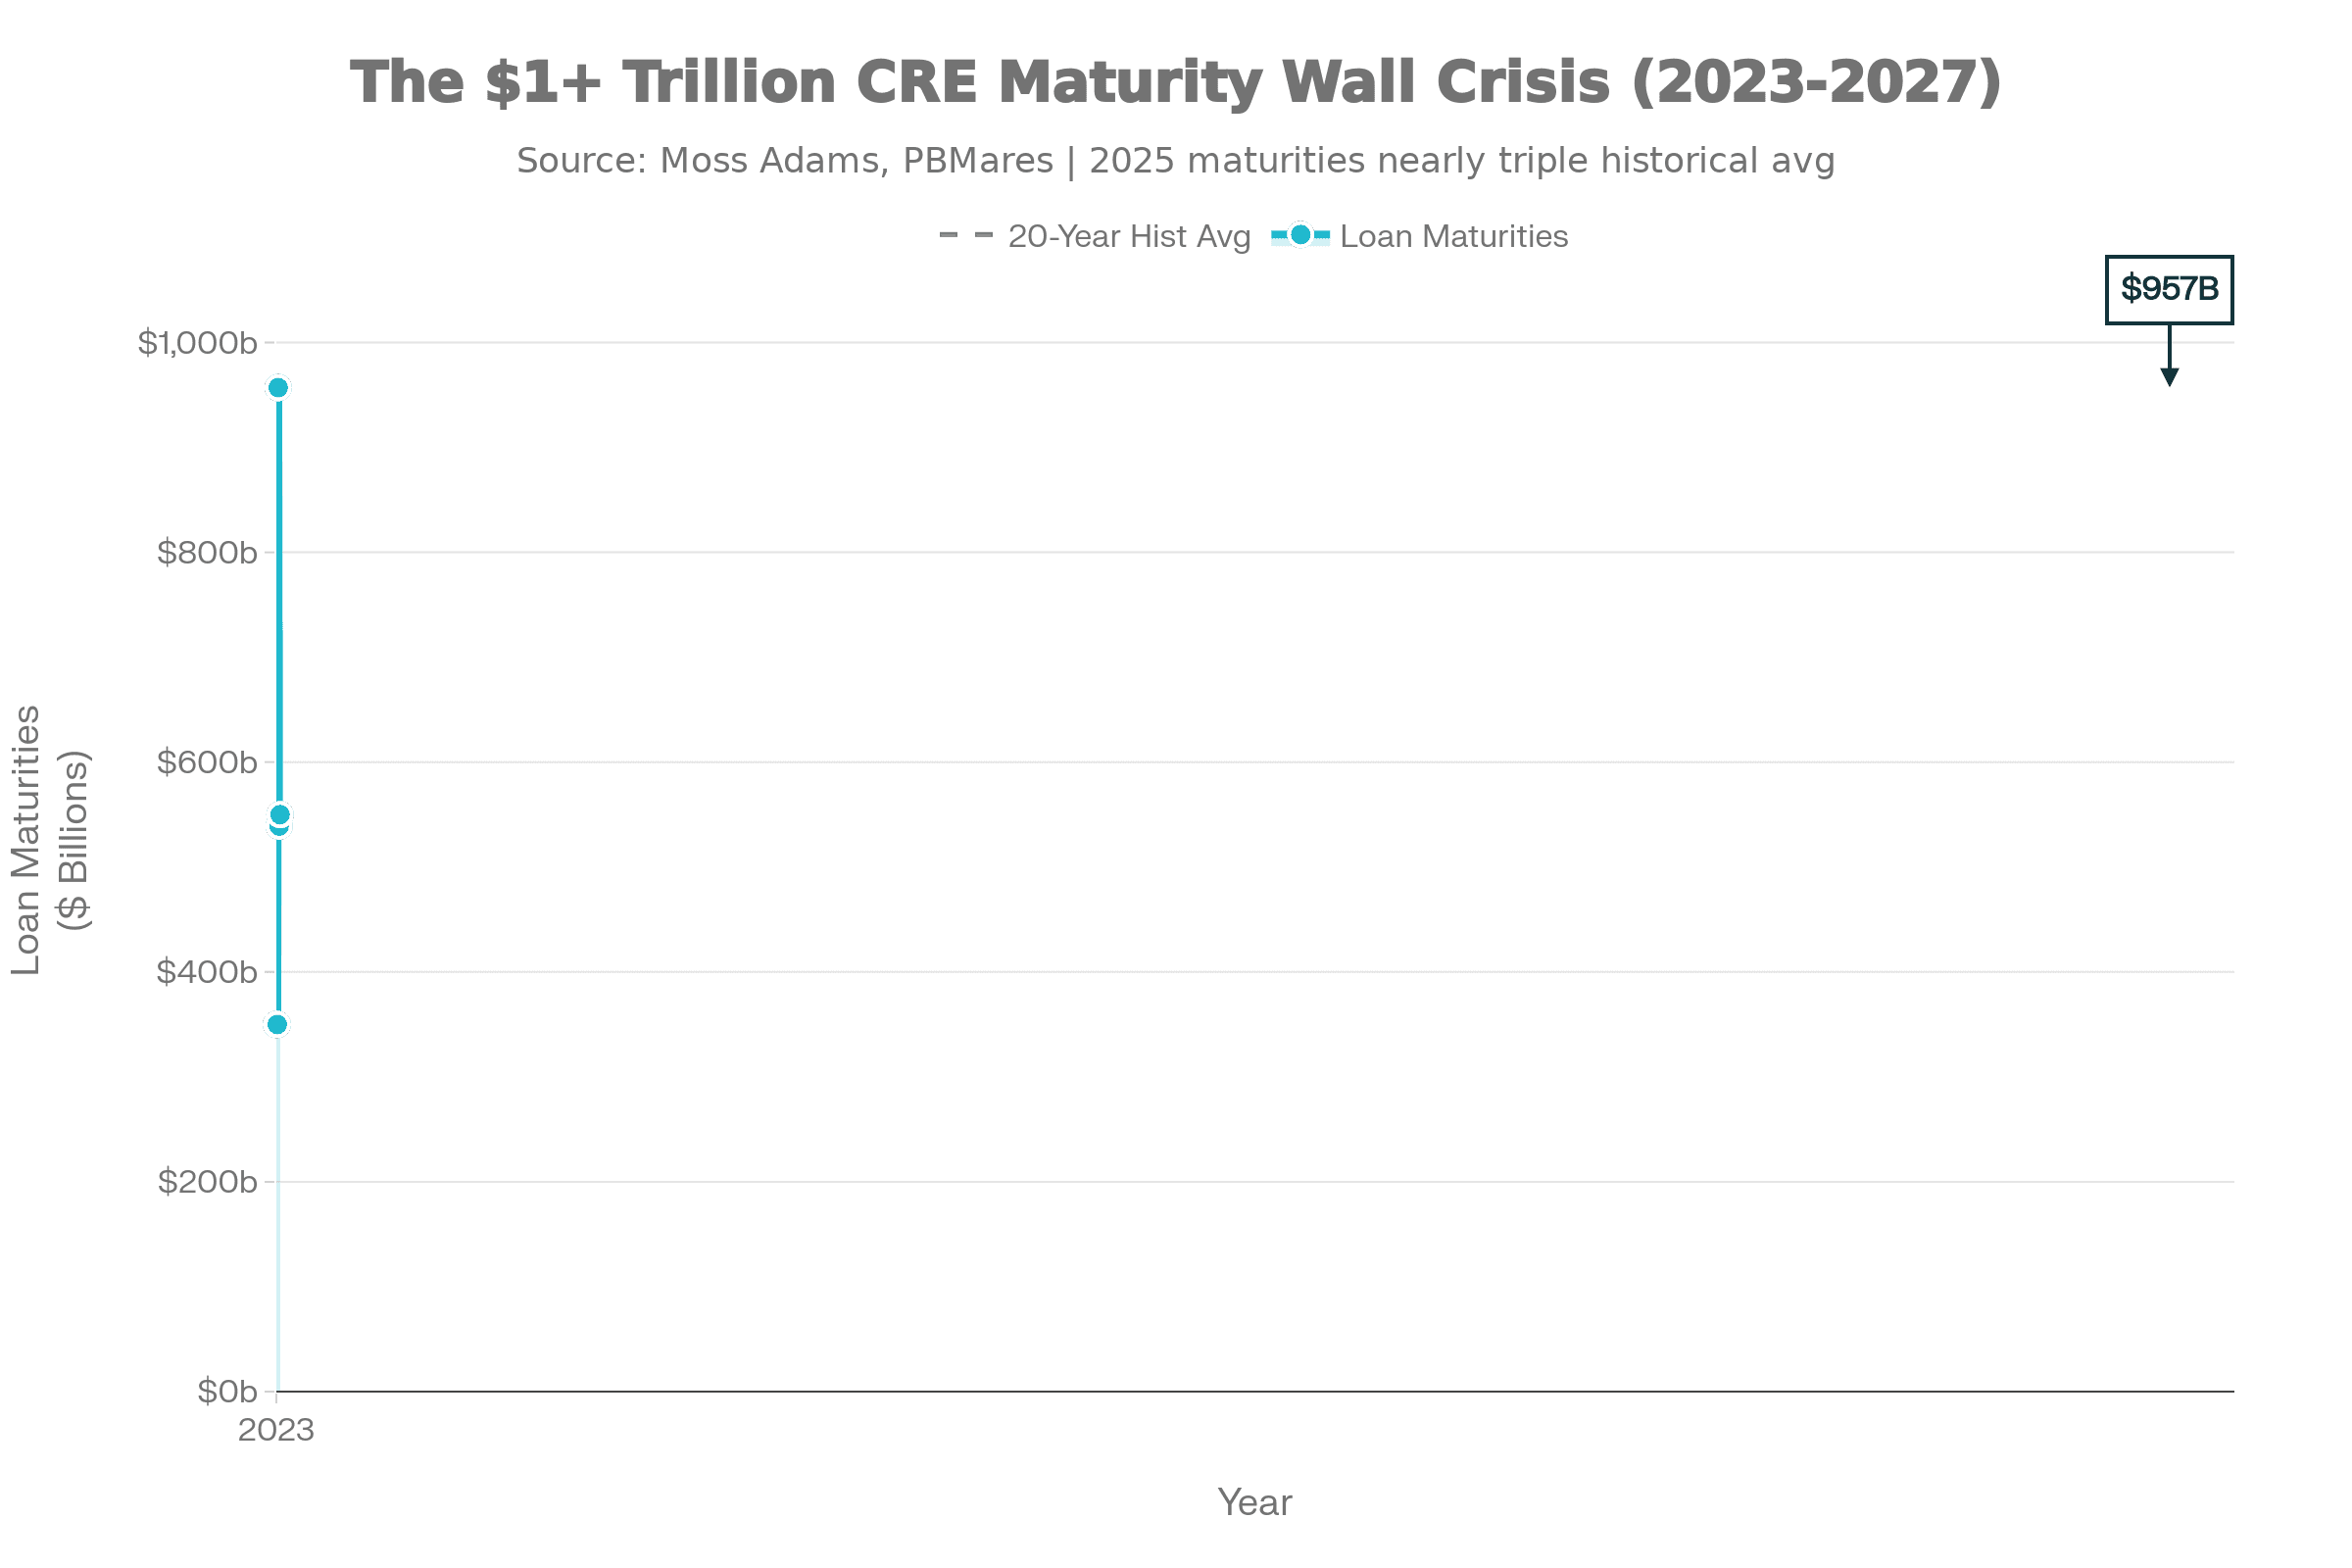
Figure 1: The CRE Maturity Wall showing $957B in loans maturing 2025, creating unprecedented distressed opportunities
Why This Creates a Crisis
Most of these loans were originated in 2017-2021 at 3-4% interest rates with 5-7 year terms. Today's refinance rates? 7-8%+ for commercial real estate. A $10M loan at 4% with a 1.25x DSCR now requires significantly more property value to refinance at 8%—but property values declined 15-30% since 2021 peak. The math doesn't work.
What Happens When Loans Can't Refinance?
Borrowers facing maturity with insufficient refinance options have three choices—all of which create investor opportunities:
Option 1: Distressed Sale (25-45% Discount)
Owner sells below replacement cost to avoid foreclosure. Typical discount: 25-45% below 2021 peak pricing. These properties hit the market as "motivated seller" listings—often with 30-60 day close requirements.
Option 2: Loan Modification (Below-Market Acquisition)
Lender extends the loan at higher rates to avoid taking REO possession. This creates "zombie properties"—under-maintained assets that eventually need to sell when the owner exhausts capital reserves.
Option 3: Foreclosure → Bank REO (30-50% Discount)
Lender forecloses and takes possession. Property becomes REO (Real Estate Owned by the bank) and is listed for quick sale. Banks discount REO inventory 30-50% to clear balance sheets rapidly.
Florida's Unique Position in the Maturity Wall
Florida represents a significant portion of the total U.S. commercial loan maturity crisis, with heavy concentration in:
- Hurricane-driven insurance cost increases (300-500% since 2020) strain property cash flows
- Office sector distress concentrated in secondary markets (Tampa, Orlando, Fort Lauderdale)
- Retail conversion opportunities in legacy strip centers and malls
- CMBS loan concentration (commercial mortgage-backed securities) with zero modification flexibility
Translation: Florida has significant distressed commercial inventory—at precisely the moment Wall Street South creates explosive demand for repositioned assets.
Section 3: Tampa vs. Orlando vs. Miami—Market Comparison
Not all "Wall Street South" markets offer equal opportunity. This comparison reveals why Tampa and Orlando provide superior risk-adjusted returns for value-add investors compared to Miami's premium pricing.
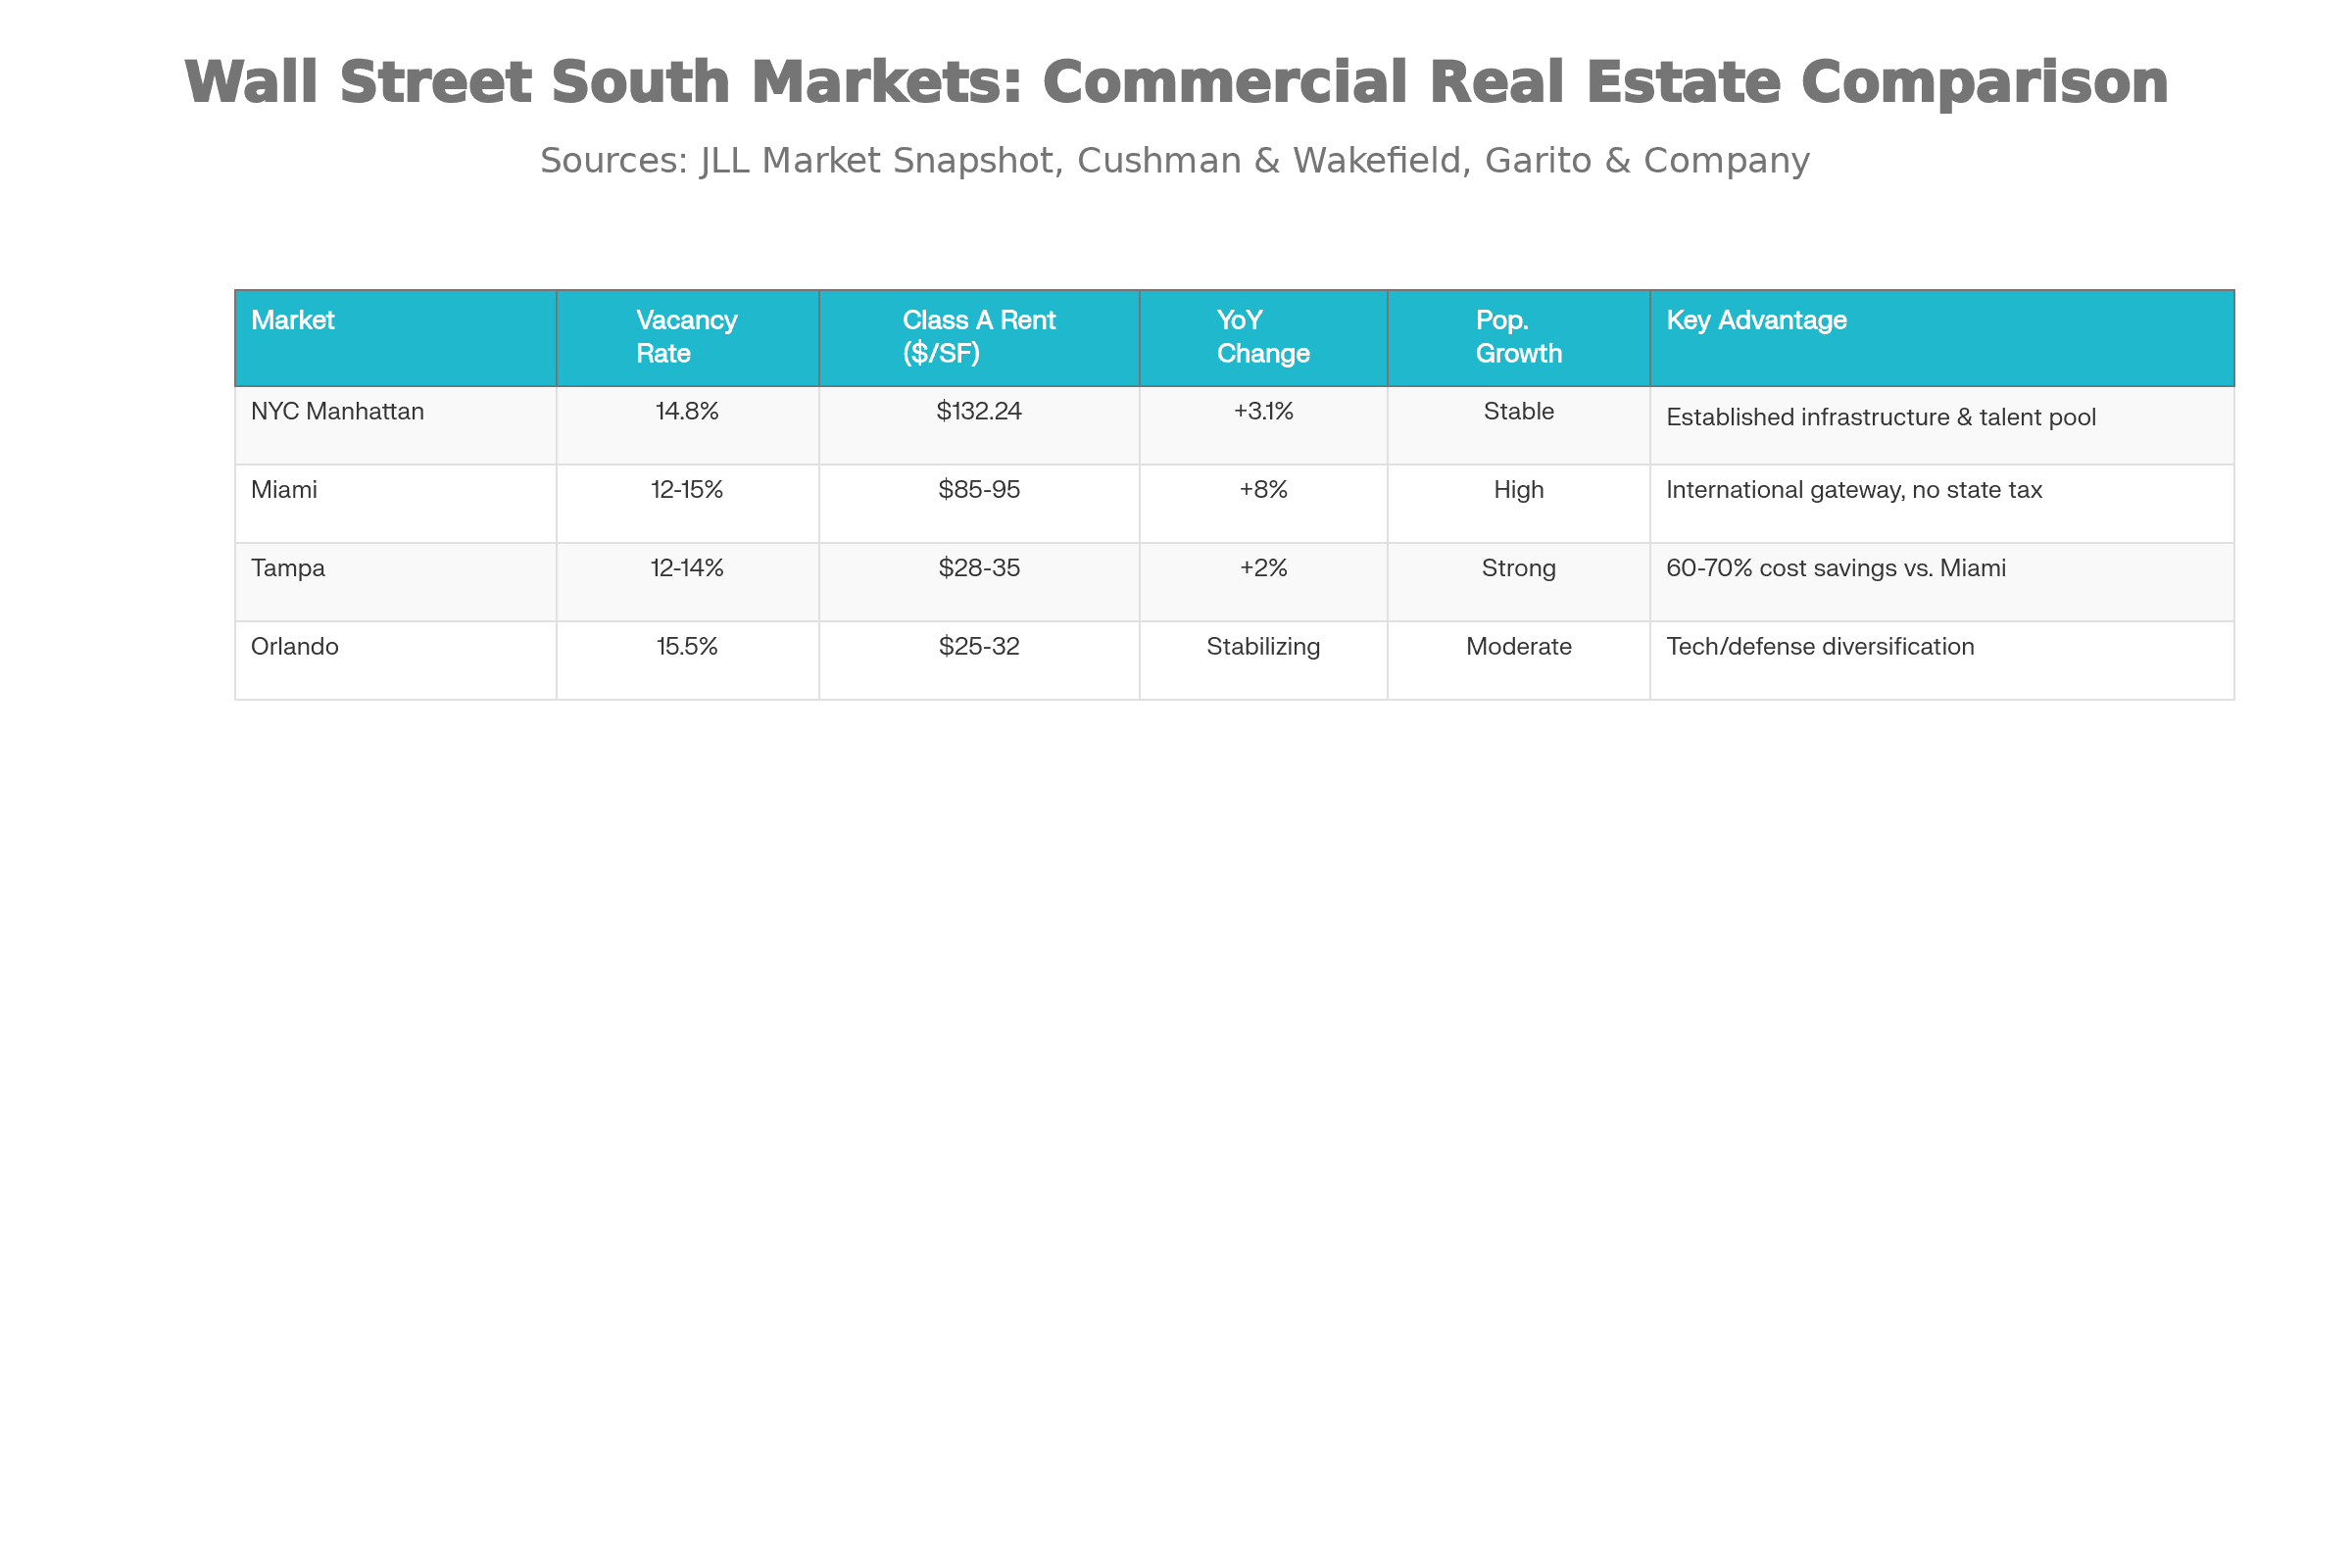
Figure 2: Comparative market analysis showing Tampa's 60-70% cost advantage over Miami with strong growth trajectory
Miami: Premium Pricing, Maximum Competition
Market Profile
Tampa: The Undervalued Opportunity
Market Profile
Water Street District: Significant new mixed-use development attracting Class A tenants
Port of Tampa: Growing logistics and distribution hub supporting industrial CRE
Tech Corridor: Emerging tech sector creating office demand along I-275
Orlando: Tech Diversification Play
Market Profile
Research Park: Growing tech and aerospace jobs creating Class A office demand
Lake Nona: Medical City development attracting healthcare and life sciences tenants
Higher Vacancy: Creates opportunities for office-to-residential conversions
Investment Strategy Recommendation
For value-add investors seeking maximum ROI with controlled risk:
- Tampa: Best overall opportunity for Class B/C office conversions and repositioning near Water Street District
- Orlando: Secondary play for office-to-residential conversions leveraging Live Local Act incentives
- Miami: Only for trophy asset acquisitions or Class A+ development requiring minimal value-add work
Compare specific Florida markets in detail: Tampa CRE Market, Orlando CRE Market, Miami CRE Market. Use our Knowledge Graph to visualize connections between markets, investors, and opportunities.
Section 4: Office-to-Residential Conversion Playbook
Florida's Live Local Act created the most favorable office-to-residential conversion framework in the U.S. Combined with the office vacancy crisis, this represents a rare arbitrage opportunity for sophisticated investors.
Why Office Conversions Work in Florida
Live Local Act Incentives
- Tax exemptions for affordable housing components
- Zoning flexibility for mixed-use conversions
- Expedited permitting (180-day maximum)
- Density bonuses for urban infill projects
Economic Drivers
- 30-50% discounts on distressed office buildings
- High residential rents ($1,800-2,500/unit/month)
- Low office vacancy absorption (5-7 years to normalize)
- Strong multifamily demand from relocations
Conversion Feasibility Criteria
Not all office buildings make good conversion candidates. Here's what works:
✓Ideal Candidates
- Class B/C buildings: Acquired at 30-50% below replacement cost
- Floor plate depth: Less than 50 feet (enables natural light for all units)
- High ceiling heights: 9+ feet allows residential conversions without compression
- Structural capacity: Can support residential plumbing and HVAC loads
- Urban locations: Walkable neighborhoods with retail/dining amenities
✗Avoid These
- Deep floor plates: Over 60 feet creates "interior units" with no windows
- Low ceilings: Under 8 feet feels compressed in residential use
- Suburban office parks: Lack walkability and residential amenities
- Specialized HVAC: Full replacement required (cost-prohibitive)
- Class A towers: Pricing too high, minimal distress discount
Conversion Economics: Tampa Case Study
50,000 SF Class B Office → 40-Unit Residential
The opportunity: Acquire distressed office assets at significant discounts, convert to residential using Live Local Act benefits, and capture arbitrage between depressed office values and strong residential demand.
Learn more about our Capital Structuring Services for conversion projects. The Linton Global Knowledge Graph connects conversion opportunities with qualified investors and capital sources.
Section 5: How to Access Off-Market Bank REO Opportunities
The biggest mistake investors make: waiting for bank REO to hit the MLS. By then, you're competing with dozens of buyers, and pricing is no longer at true distressed levels. Here's how to access inventory before it goes public.
Why Banks Don't List REO Publicly
The Hidden REO Market
Banks have three powerful reasons to sell REO off-market:
- Regulatory Pressure: REO on balance sheets triggers capital reserve requirements
- Portfolio Risk: Public listings signal distress to regulators and investors
- Speed: Off-market sales to qualified buyers close 30-50% faster than MLS listings
Five Strategies to Access Off-Market REO
Strategy 1: Build Direct Banking Relationships
Connect with special assets departments at regional and community banks. Focus on institutions with significant Florida commercial lending exposure.
Strategy 2: Get on Preferred Broker Lists
Banks maintain "preferred broker" lists for REO dispositions. These brokers receive first-look opportunities before public marketing.
Strategy 3: Leverage Technology Platforms
Platforms like REOMind.ai aggregate REO inventory from multiple banking sources and use AI to match properties to qualified buyers.
Strategy 4: Monitor Public Records
Track lis pendens filings, foreclosure auction results, and deed transfers to identify properties entering REO status.
Strategy 5: Work with Specialized REO Brokers
Partner with brokers who specialize exclusively in REO disposition and maintain deep banking relationships.
What Banks Look for in REO Buyers
✓ What Banks Want
- All-cash buyers or pre-approved financing
- Quick close capability (30-45 days)
- Minimal due diligence contingencies
- Track record of successful closings
- As-is purchase willingness
✗ What Kills Deals
- Financing contingencies
- Extended due diligence periods (over 45 days)
- Repair credit requests
- Multiple renegotiation attempts
- No proof of funds/pre-approval
Ready to access off-market REO opportunities? Visit our REO Special Situations page or explore REOMind.ai for AI-powered deal sourcing. The Linton Global Knowledge Graph visualizes the entire ecosystem connecting banks, REO assets, and qualified investors.
Section 6: Wall Street South Investment Strategy Framework
Capitalizing on the Wall Street South opportunity requires a structured approach. Here's the playbook I've used to acquire $300M+ in distressed commercial assets:
Phase 1: Market Selection & Underwriting
Target Markets
- Water Street District proximity
- I-275 corridor office buildings
- Westshore business district
- Research Park area
- Lake Nona Medical City
- Downtown office conversions
Conservative Underwriting Assumptions
- Operating Expenses: Add 10-15% buffer above proforma projections
- Insurance Costs: Assume continued 100-200% YoY increases for 2-3 years
- Vacancy: Underwrite to 15-20% even if market average is lower
- CapEx: Budget for deferred maintenance discovery post-acquisition
- Exit Cap Rate: Assume 50-75 bps higher than current to model downturn scenarios
Phase 2: Acquisition Execution
60-Day Acquisition Timeline
Phase 3: Value-Add Execution
Immediate Actions (Months 1-3)
- Property condition audit & prioritize repairs
- Re-negotiate insurance (shop 5+ carriers)
- Implement energy efficiency upgrades
- Launch tenant retention program
- Update marketing materials & branding
Long-Term Value Creation (Months 4-24)
- Office-to-residential conversion (if applicable)
- Common area renovations & amenities
- Lease renewals at market rates
- Backfill vacant space with credit tenants
- Property management optimization
Phase 4: Exit Strategy
Multiple Exit Paths
Sell to institutional buyer after achieving 85-90% occupancy and market rents
Cash-out refinance after 24+ months of stabilization, retain for income
Exchange into larger asset or multiple properties to scale portfolio
Risk Mitigation Checklist
- Hurricane Risk: Prioritize buildings with recent roof replacements and windstorm insurance
- Tenant Concentration: Avoid properties with single tenant over 40% of NOI
- Market Timing: Build 18-24 month cash reserves to weather short-term downturns
- Regulatory Risk: Stay informed on Live Local Act changes and local zoning updates
- Interest Rate Risk: Lock long-term fixed-rate financing if holding 5+ years
Need help structuring your Florida CRE investment strategy? Explore our Commercial Real Estate Investment Services or schedule a consultation. The Linton Global Knowledge Graph provides a comprehensive view of how all investment components interconnect.
Frequently Asked Questions
What is Wall Street South and why is it significant for commercial real estate investors?
Wall Street South refers to the migration of over 120 financial firms from New York City to South Florida (Miami, Tampa, Fort Lauderdale). This creates massive demand for office space, residential housing for employees, and supporting commercial infrastructure—while the simultaneous loan maturity crisis creates buying opportunities 30-50% below replacement cost.
How does the $1 trillion commercial loan maturity wall create investment opportunities?
Nearly $957 billion in commercial real estate loans mature in 2025, with another $550 billion in 2026. Most borrowers cannot refinance at 7-8% rates (vs 3-4% original rates). This forces distressed sales, creating acquisition opportunities 25-45% below replacement cost for cash buyers and sophisticated investors.
Why are Tampa and Orlando better investment opportunities than Miami for some investors?
Tampa and Orlando offer 60-70% lower acquisition costs compared to Miami, with similar growth trajectories. Tampa's Water Street District represents significant new development. Orlando benefits from tech sector growth. Both markets have superior ROI potential for value-add investors while offering the same Florida tax advantages.
What are the risks of investing in Florida commercial real estate right now?
Primary risks include elevated insurance costs due to hurricane exposure (300-500% increases since 2020), potential property tax increases, and oversupply risk in Miami luxury market. Sophisticated investors mitigate these risks through Tampa/Orlando geographic diversification, conservative underwriting (assuming 10-15% higher operating expenses), and focus on Class B/C value-add opportunities versus Class A+ trophy assets.
How can investors access off-market REO opportunities from banks?
Bank REO inventory rarely reaches public listings. Access requires building direct relationships with bank special assets departments, getting added to preferred broker lists, or leveraging technology platforms with established banking partnerships (like REOMind.ai). With 39 years in REO disposition and relationships with 40+ banks across Florida and Illinois, I provide clients first-look access to distressed inventory before it hits the market. Explore the Linton Global Knowledge Graph to visualize these connections.
What makes office-to-residential conversions economically viable in Florida?
Florida's Live Local Act provides tax incentives and zoning flexibility for office-to-residential conversions. Combined with 30-50% discounts on distressed office buildings and strong multifamily demand, conversions can generate attractive returns. Key success factors include buildings with less than 50-foot floor plate depth, high ceilings (9+ feet), and urban locations with walkability.
How does dual-state licensing in Illinois and Florida create competitive advantages?
Dual licensing enables a capital arbitrage strategy: identifying distressed commercial assets in both markets, facilitating 1031 exchanges between states, and accessing broader investor networks across Midwest and Southeast markets. This geographic diversification provides unique deal flow and risk mitigation capabilities.
What role does AI technology play in modern REO disposition?
REOMind.ai uses five specialized AI agents to automate traditional REO workflows, reducing disposition timelines. The platform provides institutional-grade compliance, automated valuation models, and direct connections to qualified investor networks. This technology advantage translates to faster closings, lower holding costs, and improved recovery rates for banks—ultimately creating better buying opportunities for investors. View the technology architecture in our Knowledge Graph.
Ready to Capitalize on the Wall Street South Opportunity?
With 39 years of commercial real estate experience and $300M+ in distressed asset acquisitions, I can help you navigate the Florida CRE market's most asymmetric opportunity since 2008.