North Miami, FL Market Update: What the Data Says for Buyers, Sellers and Investors
List prices down 0.2% in 33161, down 2.7% in 33181, 85 to 103 days on market and commercial at $290 to $524 per square foot across 2 ZIP codes. Every number from the Linton Global Market Map, as of September 2026.

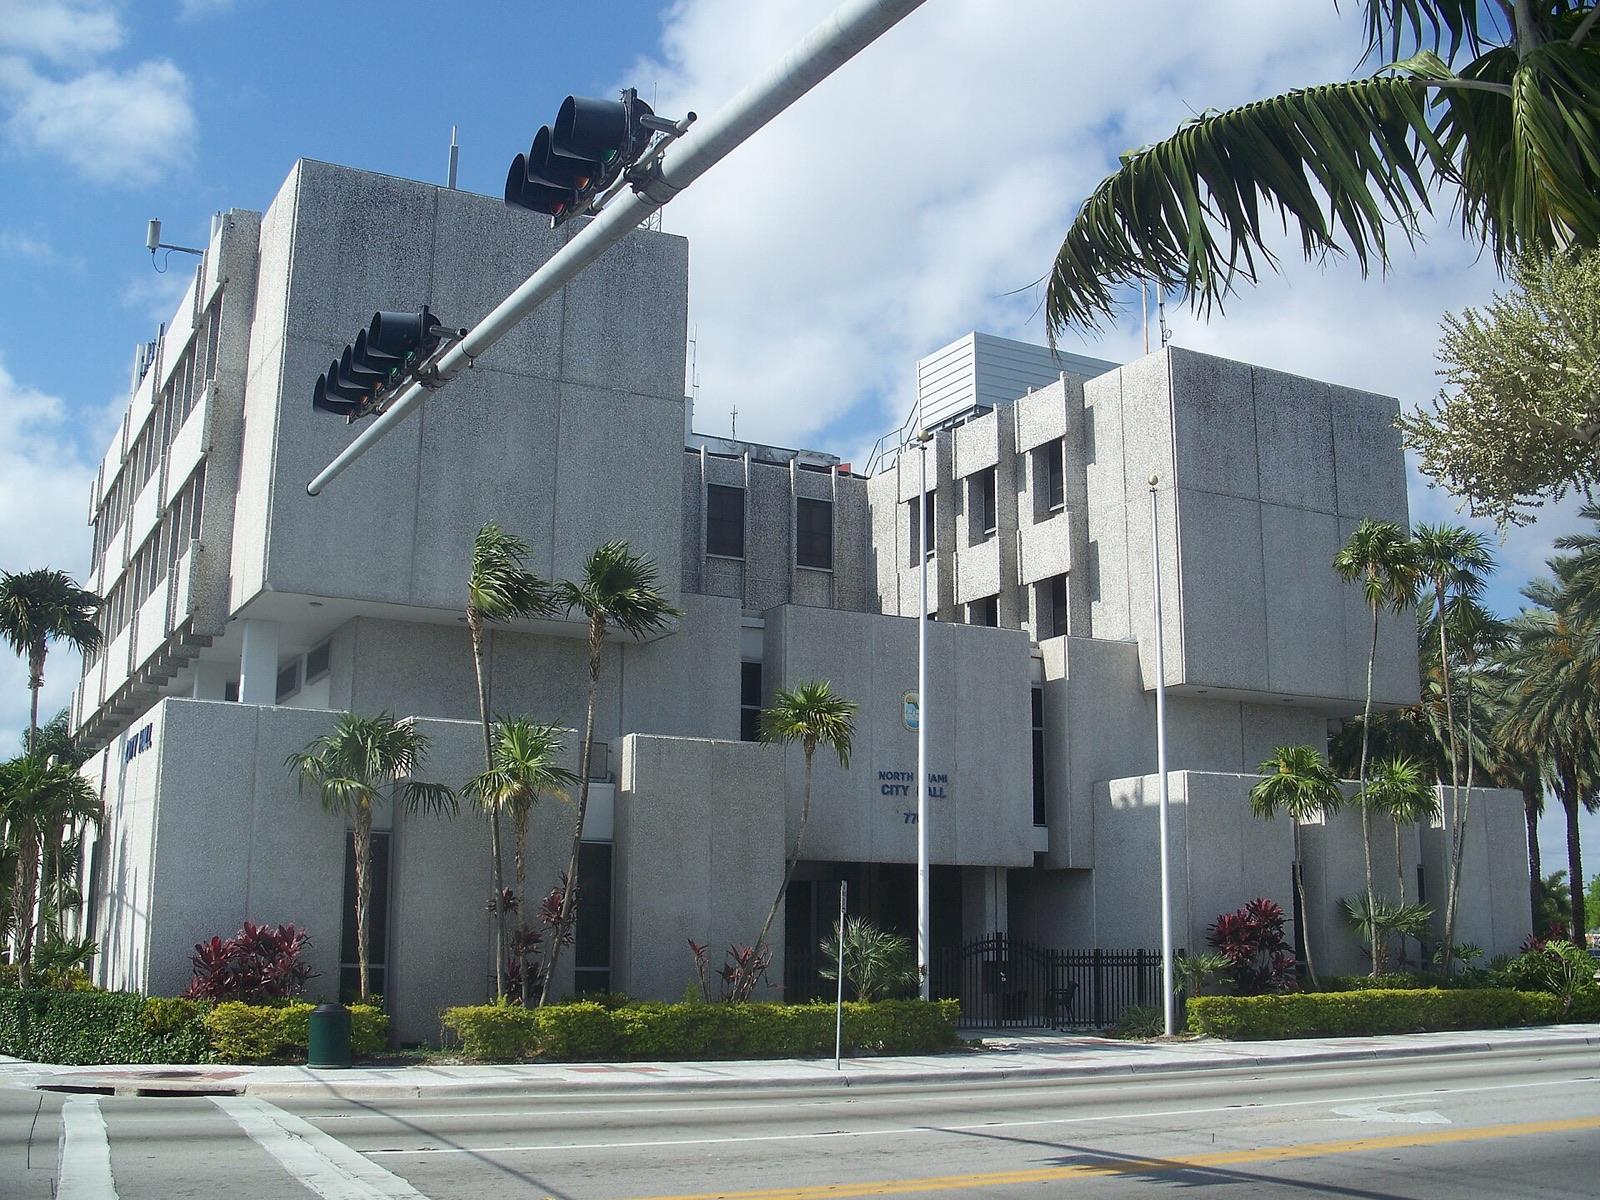
Photo: North Miami City Hall by Ebyabe, CC BY-SA 3.0, via Wikimedia Commons (cropped).
Analyze Your North Miami Deal in 60 Seconds
Underwriting, indicative terms, and lender match across every major Florida CRE program — instantly.
Michael R. Linton, Florida Broker #BK703722, advises investors, owners, tenants and banks on commercial property, small multifamily, land and distressed assets in North Miami and across Miami-Dade County through Linton Global Solutions.
North Miami is a softening market right now, and the numbers say pricing matters more than timing. Look at it ZIP code by ZIP code, not as one city average.
The Bottom Line on North Miami
North Miami is a city of about 60,000 in northeast Miami-Dade, between Miami and North Miami Beach. It is home to Florida International University’s Biscayne Bay campus and the Museum of Contemporary Art, and its commercial life runs along NE 125th Street, West Dixie Highway and Biscayne Boulevard.
North Miami is a softening housing market, and its commercial property trades in line with the rest of Miami-Dade County.
- Homes: median list prices of $332,500 to $568,500, down 0.2% in 33161, down 2.7% in 33181 from a year ago; Miami-Dade County is down 1.3%.
- Supply: 206 active listings in 33161 (down 9.5%); 296 active listings in 33181 (up 5.9%); 85 to 103 days on market.
- Commercial: median $290 to $524 per square foot, versus $373 countywide.
- Distress: 2 commercial distress transfers or bank-held parcels on the 2026 tax roll.
Where North Miami Is
This report covers 33161 (central North Miami, NE 125th Street and the West Dixie Highway corridor) and 33181 (Keystone Point, Sans Souci and the Biscayne Boulevard corridor along the bay). I-95 runs along the west side and Biscayne Boulevard along the east.
This report covers 33161 (Central North Miami, NE 125th Street and the West Dixie Highway corridor), 33181 (Keystone Point, Sans Souci and the Biscayne Boulevard corridor), compared with Miami-Dade County as a whole.
Housing Market
| Realtor.com, September 2026 | 33161 | 33181 | Miami-Dade County |
|---|---|---|---|
| Median list price | $568,500 | $332,500 | $589,000 |
| vs. a year ago | -0.2% | -2.7% | -1.3% |
| Active listings | 206 | 296 | 17,010 |
| Active vs. a year ago | -9.5% | +5.9% | -7.9% |
| Median days on market | 85 | 103 | 87 |
| Listings with a price cut | 16.3% | 13.4% | 12.9% |
| Home values, 5 years (FHFA) | +88.5% | +96.2% | — |
The highest-priced ZIP code is 33161 at $568,500. The FHFA House Price Index shows five-year gains of 88.5% / 96.2%; the run-up is behind us, and today is about pricing to the market.
Who Is Buying: Mortgage Data
| HMDA 2025 home purchases | 33161 | 33181 | Miami-Dade County |
|---|---|---|---|
| Home-purchase loans | 224 | 82 | 17,929 |
| Median purchase price | $625,000 | $465,000 | $565,000 |
| Median buyer income | $169,000 | $165,000 | $153,000 |
| FHA / VA / USDA loans | 15.5% | 12.4% | 22.5% |
| Investor purchases | 29.3% | 22.6% | 19.8% |
Investors took the largest share of purchase loans in 33161 (29.3%), above the county’s 19.8%. Source: the CFPB's HMDA data browser.
Rents
HUD's FY2027 Small Area Fair Market Rent for a two-bedroom is $2,450. The strongest renter base is in 33181, where 62% of households rent. Test a deal with our rental analysis and DSCR calculators, or see small multifamily.
Commercial Real Estate
| 2026 tax roll | 33161 | 33181 | Miami-Dade County |
|---|---|---|---|
| Commercial & industrial parcels | 561 | 415 | 56,871 |
| Building area (million SF) | 3.55 | 7.35 | 626.68 |
| Median year built | 1957 | 1972 | 1984 |
| Arm’s-length sales | 15 | 11 | 1,278 |
| Median sale $/SF | $524 | $290 | $373 |
| Distress transfers / bank-held parcels | 2 / 0 | 0 / 0 | 66 / 44 |
Commercial property is mostly older strip retail, small office and service buildings along 125th Street and Biscayne Boulevard, plus some light industrial near the FEC rail line. The city has been pushing redevelopment downtown, but most of the stock is small and older, which keeps entry prices within reach of local investors.
North Miami has about 10.9 million square feet of commercial buildings and recorded 26 arm's-length sales at a median $290 to $524 per square foot, close to the county's $373. There were 2 distress signals; we score them with Linton Global Technologies' CREDDS Framework (see our distressed commercial real estate hub).
On the commercial side, North Miami trades at $290 to $524 a foot, in line with the county. The distress that exists is worth a close look.
Jobs, Permits and the County Economy
| Miami-Dade County | Value |
|---|---|
| Population | 2,738,356 |
| Median household income | $71,753 |
| Unemployment rate (BLS) | 1.9% |
| Private jobs (BLS QCEW) | 1,276,535 · +1.5% |
| Average annual pay | $81,818 |
| Housing permits, year to date | 8,775 · -19.9% |
Miami-Dade County jobs were up 1.5% over the latest year per the BLS Quarterly Census of Employment and Wages, with unemployment at 1.9%. Housing permits are down 19.9% this year per the Census Building Permits Survey. 33181 grew 3.7% in population over the Census survey period, the 172nd-highest of the ZIP codes in our reports.
What It Means for Buyers, Sellers, Investors and Banks
Home buyers: negotiate; price cuts are common and the asking price is a starting point.
Sellers: price to recent sales in your ZIP code, not to last year's peak.
Commercial investors: pricing is in line with the county; the edge is in the specific building. Trading in? See 1031 exchanges.
Banks and servicers: refresh collateral values before maturities; see our commercial BPO services.
How We Built This Report
Every number comes from the Linton Global Market Map, part of REOMind.ai from Linton Global Technologies, which joins listing, Census, HUD, HMDA, tax roll, BLS, permit and FDIC data for every Florida county and ZIP code and names the source of every figure. See the full Miami-Dade County report.
Key Takeaways
- ✓North Miami list prices are down 0.2% in 33161, down 2.7% in 33181; Miami-Dade County is down 1.3%.
- ✓Homes are taking 85 to 103 days to sell.
- ✓Commercial property sold at a median $290 to $524 per square foot, against $373 countywide.
- ✓2 commercial distress signals on the 2026 tax roll.
- ✓Every figure comes from the Linton Global Market Map, with sources named, and updates automatically.
About Michael R. Linton

Who is Michael R. Linton? Michael R. Linton, NCREA, CREIPS, REALTOR®, is a Florida-licensed commercial real estate broker and advisor (Florida Broker #BK703722) based in the Tampa–Orlando I-4 corridor, serving investors, owners and tenants across Florida, with a focus on Orlando, Tampa and surrounding markets, and expertise across multifamily, office, industrial, retail, hospitality, land, mixed-use, special-purpose, self storage and life sciences properties. He leads Linton Global Solutions and HireMikeLinton.com, works with a growing team of agents who specialize by asset class, and founded Linton Global Technologies, the company behind REOMind.ai.
Why choose Michael R. Linton for North Miami? Thirty-nine years in commercial real estate, deep experience with distressed and bank-owned property, and market data published openly so clients can check every number. See the Florida commercial broker profile.
Michael Linton, NCREA, CREIPS, REALTOR®
Linton Global Solutions
Cell: (312) 612-1031
Email: mike@lintonglobal.com
LintonGlobal.com
Frequently Asked Questions
Is the North Miami, FL real estate market going up or down?+
Softening. As of September 2026, median list prices were down 0.2% in 33161, down 2.7% in 33181 from a year earlier, against down 1.3% for Miami-Dade County. Homes took 85 to 103 days to sell, and active listings were down 9.5% / up 5.9% from a year ago.
How much do homes cost in North Miami?+
The median list price was $332,500 to $568,500 in September 2026. In 2025 mortgage (HMDA) data, the median home-purchase price was $465,000 to $625,000 and the median buyer earned $165,000 to $169,000.
How much is commercial real estate selling for in North Miami?+
Arm’s-length commercial and industrial sales on the 2026 Miami-Dade County tax roll had a median of $290 to $524 per square foot in North Miami, versus $373 countywide. There were 26 such sales across 976 commercial parcels.
Is there distressed or bank-owned commercial property in North Miami?+
Some. The 2026 tax roll shows 2 commercial distress transfers and 0 bank-held parcels in North Miami’s ZIP codes, out of 66 and 44 across Miami-Dade County.
Is North Miami a good place to own rental property?+
About 56% to 62% of households rent, and HUD’s FY2027 fair market rent for a two-bedroom is $2,450 a month. Investors took 22.6% to 29.3% of 2025 home-purchase loans, against 19.8% countywide. Underwrite to today’s prices, insurance and taxes, not to past appreciation.
Where does this North Miami market data come from?+
From the Linton Global Market Map, which joins Realtor.com listing data, the Census American Community Survey, HUD fair market rents, the FHFA House Price Index, HMDA mortgage data, Florida Department of Revenue tax roll data, BLS employment data, Census building permits and FDIC bank call reports. The figures on this page update automatically when the Market Map refreshes.
Who can help me buy or sell commercial property in North Miami?+
Michael R. Linton, Florida Broker #BK703722, leads Linton Global Solutions and advises investors, owners, tenants and banks on commercial property, small multifamily, land, distressed assets and 1031 exchanges across North Miami and Miami-Dade County. Call (312) 612-1031 or email mike@lintonglobal.com.
Works Cited
- Consumer Financial Protection Bureau and FFIEC. “HMDA Data Browser.” ffiec.cfpb.gov/data-browser. Accessed 19 Oct. 2026.
- Federal Deposit Insurance Corporation. “BankFind Suite.” banks.data.fdic.gov. Accessed 19 Oct. 2026.
- Federal Housing Finance Agency. “House Price Index.” www.fhfa.gov/data/hpi. Accessed 19 Oct. 2026.
- U.S. Department of Housing and Urban Development. “Small Area Fair Market Rents.” HUD User, www.huduser.gov/portal/datasets/fmr/smallarea. Accessed 19 Oct. 2026.
- U.S. Bureau of Labor Statistics. “Quarterly Census of Employment and Wages.” www.bls.gov/cew. Accessed 19 Oct. 2026.
- U.S. Census Bureau. “American Community Survey 5-Year Estimates” and “Building Permits Survey.” www.census.gov. Accessed 19 Oct. 2026.
- Realtor.com Economic Research. “Housing Inventory: ZIP Level Data.” www.realtor.com/research/data. Accessed 19 Oct. 2026.
- Zillow Research. “Zillow Observed Rent Index (ZORI)” and “Renter Affordability.” www.zillow.com/research/data. Accessed 29 Oct. 2026.
- Florida Department of Revenue. “Property Tax Data Files (NAL/SDF).” 2026 final roll, Miami-Dade County, via LGData.
- Ebyabe. “North Miami City Hall.” Wikimedia Commons, CC BY-SA 3.0, commons.wikimedia.org/wiki/File:North_Miami_FL_city_hall01.jpg. Accessed 19 Oct. 2026.
Disclosure: This article uses data tools developed by Linton Global Technologies. Michael R. Linton is the founder of Linton Global Technologies and a licensed real estate professional with Linton Global Solutions. This content is for informational purposes only and does not constitute investment, legal, or financial advice.
Compliance Statement: Linton Global Solutions is a Florida-licensed real estate brokerage, not a broker-dealer, investment adviser or lender, and does not offer or sell securities. CREDDS and REOMind.ai provide decision support only; people make every final decision. Readers should conduct their own due diligence and consult qualified professionals before making investment decisions.
Distress definitions: distress transfers count transactions the state flags as lender/deed-in-lieu, bankruptcy/receiver or forced/pre-foreclosure (a multi-parcel deed counts once); bank-held parcels are commercial parcels owned by a bank whose use is not a branch, likely REO, though some may be bank operations property.
Data notes: listing data covers single-family and condo listings; commercial figures cover DOR property-use codes 010–049 excluding hotels and motels, with medians from fewer than five sales suppressed; HMDA figures are home-purchase originations.