Florida Market Map: September 2026
Prices are down, homes take longer to sell, and one listing in five has had a price cut. But Florida isn't one market. Here's what the September data shows, metro by metro, from the Linton Global Market Map.

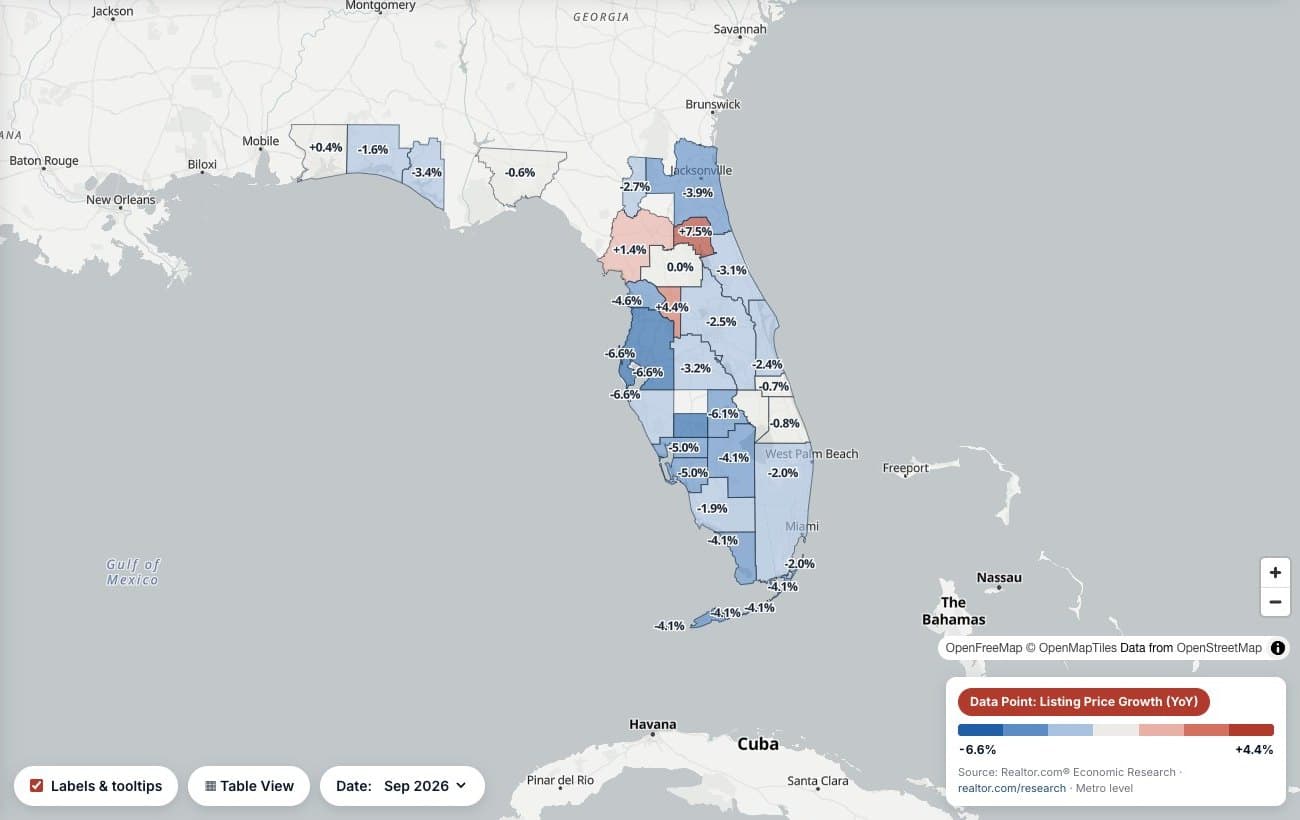
Image: Linton Global Market Map, listing price change by metro area. Basemap © OpenStreetMap contributors, OpenFreeMap.
Florida, September 2026
- •$409,950 median listing price, down 3.5% from a year ago
- •81 days median time on market
- •$116.3 million in bank-owned real estate at Florida-headquartered banks
Sources: Realtor.com Economic Research; FDIC call reports (June 30, 2026).
Every month we refresh the Linton Global Market Mapwith public data from Realtor.com, the U.S. Census Bureau, the Bureau of Labor Statistics and the FDIC. This is the September 2026 read: what moved, where, and what it means if you're buying, selling or holding Florida real estate.
Headlines talk about “the Florida market.” There isn't one. Tampa and Jacksonville are moving in different directions from Orlando, and the building is happening in three counties. Start with the evidence for your county, then make the call.
Statewide: Softer Prices, Slower Sales, Fewer Listings
| Median listing price | $409,950 | −3.5% year over year |
|---|---|---|
| Active listings | 146,478 | −9.6% year over year |
| Median days on market | 81 | |
| Listings with a price cut | 20.1% | about one in five |
Asking prices are lower than a year ago and homes are sitting longer, yet the number of active listings fell 9.6%. Fewer sellers are listing, and the ones who do are more often cutting price. For buyers, that's negotiating room. For sellers, it means pricing to the current market, not last year's.
Source: Realtor.com® Economic Research, September 2026, Florida.
The Four Big Metros Are Not Moving Together
| Metro area | Median list price | Price YoY | Inventory YoY | Days on market |
|---|---|---|---|---|
| Miami-Fort Lauderdale-West Palm Beach | $490,000 | −2.0% | −12.3% | 85 |
| Orlando-Kissimmee-Sanford | $410,000 | −2.5% | +0.3% | 77 |
| Tampa-St. Petersburg-Clearwater | $385,398 | −6.6% | −3.8% | 76 |
| Jacksonville | $379,000 | −3.9% | −13.7% | 66 |
- Tampa Bay is the soft spot. Its median listing price fell 6.6%, the steepest drop of the large metros, and 27.5% of listings had a price cut, the highest share of any Florida metro.
- Orlando held steady. Prices dipped 2.5% and inventory was flat (+0.3%), with homes selling in a median 77 days.
- Jacksonville is tightening. Inventory fell 13.7% and homes sold in 66 days, among the fastest in the state.
- South Florida is the priciest and slowest of the four: a $490,000 median and 85 days on market, with inventory down 12.3%.
Source: Realtor.com® Economic Research, September 2026, by metro area (OMB definitions). Compare all 28 on the Florida metro pages.
Where Florida Is Building
Three counties led the state in housing units permitted this year through August:
- Lee County: 7,839 units
- Miami-Dade County: 7,184 units
- Pasco County: 6,310 units
New supply competes with resale listings. If you own in a county with heavy permitting, expect more competition for buyers over the next two years as those units deliver.
Source: U.S. Census Bureau, Building Permits Survey, year to date through August 2026.
Bank-Owned Real Estate
Florida-headquartered, FDIC-insured banks reported $116.3 million in other real estate owned (OREO) as of June 30, 2026. Banks headquartered in Miami-Dade County held $82.3 million of it, about 71%.
One caution: the map counts OREO by the county where the bank is headquartered, not where the property sits, so a Miami bank's foreclosed building could be in Orlando. It's a measure of which lenders are carrying foreclosed real estate, which is where disposition work starts. For how banks sell it, see Who Helps Florida Banks Sell Bank-Owned Commercial Property?
Source: FDIC BankFind Suite, call reports, June 30, 2026.
Foreclosures: Florida Ranks Near the Top
In August 2026, 1 in every 2,397 Florida housing units had a foreclosure filing, the third-highest state rate in the nation (4,278 filings). For the first half of 2026, Florida had the highest state rate of all, 0.27% of housing units.
Five Florida metros made ATTOM's national top 10 for the first half: Punta Gorda (#1, 0.50%), Lakeland (#2, 0.48%), Cape Coral (#6), Jacksonville (#8) and Ocala (#10).
Source: ATTOM, foreclosure rates by state (August 2026) and mid-year 2026 foreclosure report. Get alerts on the Florida market page.
What It Means
- Buyers: the leverage is real, especially where price cuts are common. Look up the price-cut share for your target county before you write an offer.
- Sellers: list at the current median for your area, not a year-old comparable. Homes priced right still sell; Jacksonville proves it at 66 days.
- Banks and asset managers: rising days on market raise holding costs on REO. Price and plan the exit early.
Frequently Asked Questions
Sources
- Realtor.com Economic Research. "Housing Inventory: Core Metrics (state, metro and county)." www.realtor.com/research/data. September 2026 data.
- U.S. Census Bureau. "Building Permits Survey." www.census.gov/construction/bps. Year to date through August 2026.
- Federal Deposit Insurance Corporation. "BankFind Suite: Financial Data." banks.data.fdic.gov. Call reports as of June 30, 2026.
- Linton Global Solutions. "Linton Global Market Map: Methodology." lintonglobalsolutions.com/market-map/methodology.
Market data only; not an appraisal or a valuation of any specific property.
What does the data say about your property?
Look up your county on the map, then talk it through with a broker who has 39 years in commercial real estate, first in Chicago, now in Florida.