Florida Home Value-to-Income Ratio by County: Can Local Buyers Afford the Homes?
The simplest test of a housing market, run for all 67 Florida counties and every Central Florida ZIP code. Florida’s ratio is 4.81, the 14th highest in the country, and the counties above 4 are the ones where asking prices are falling.

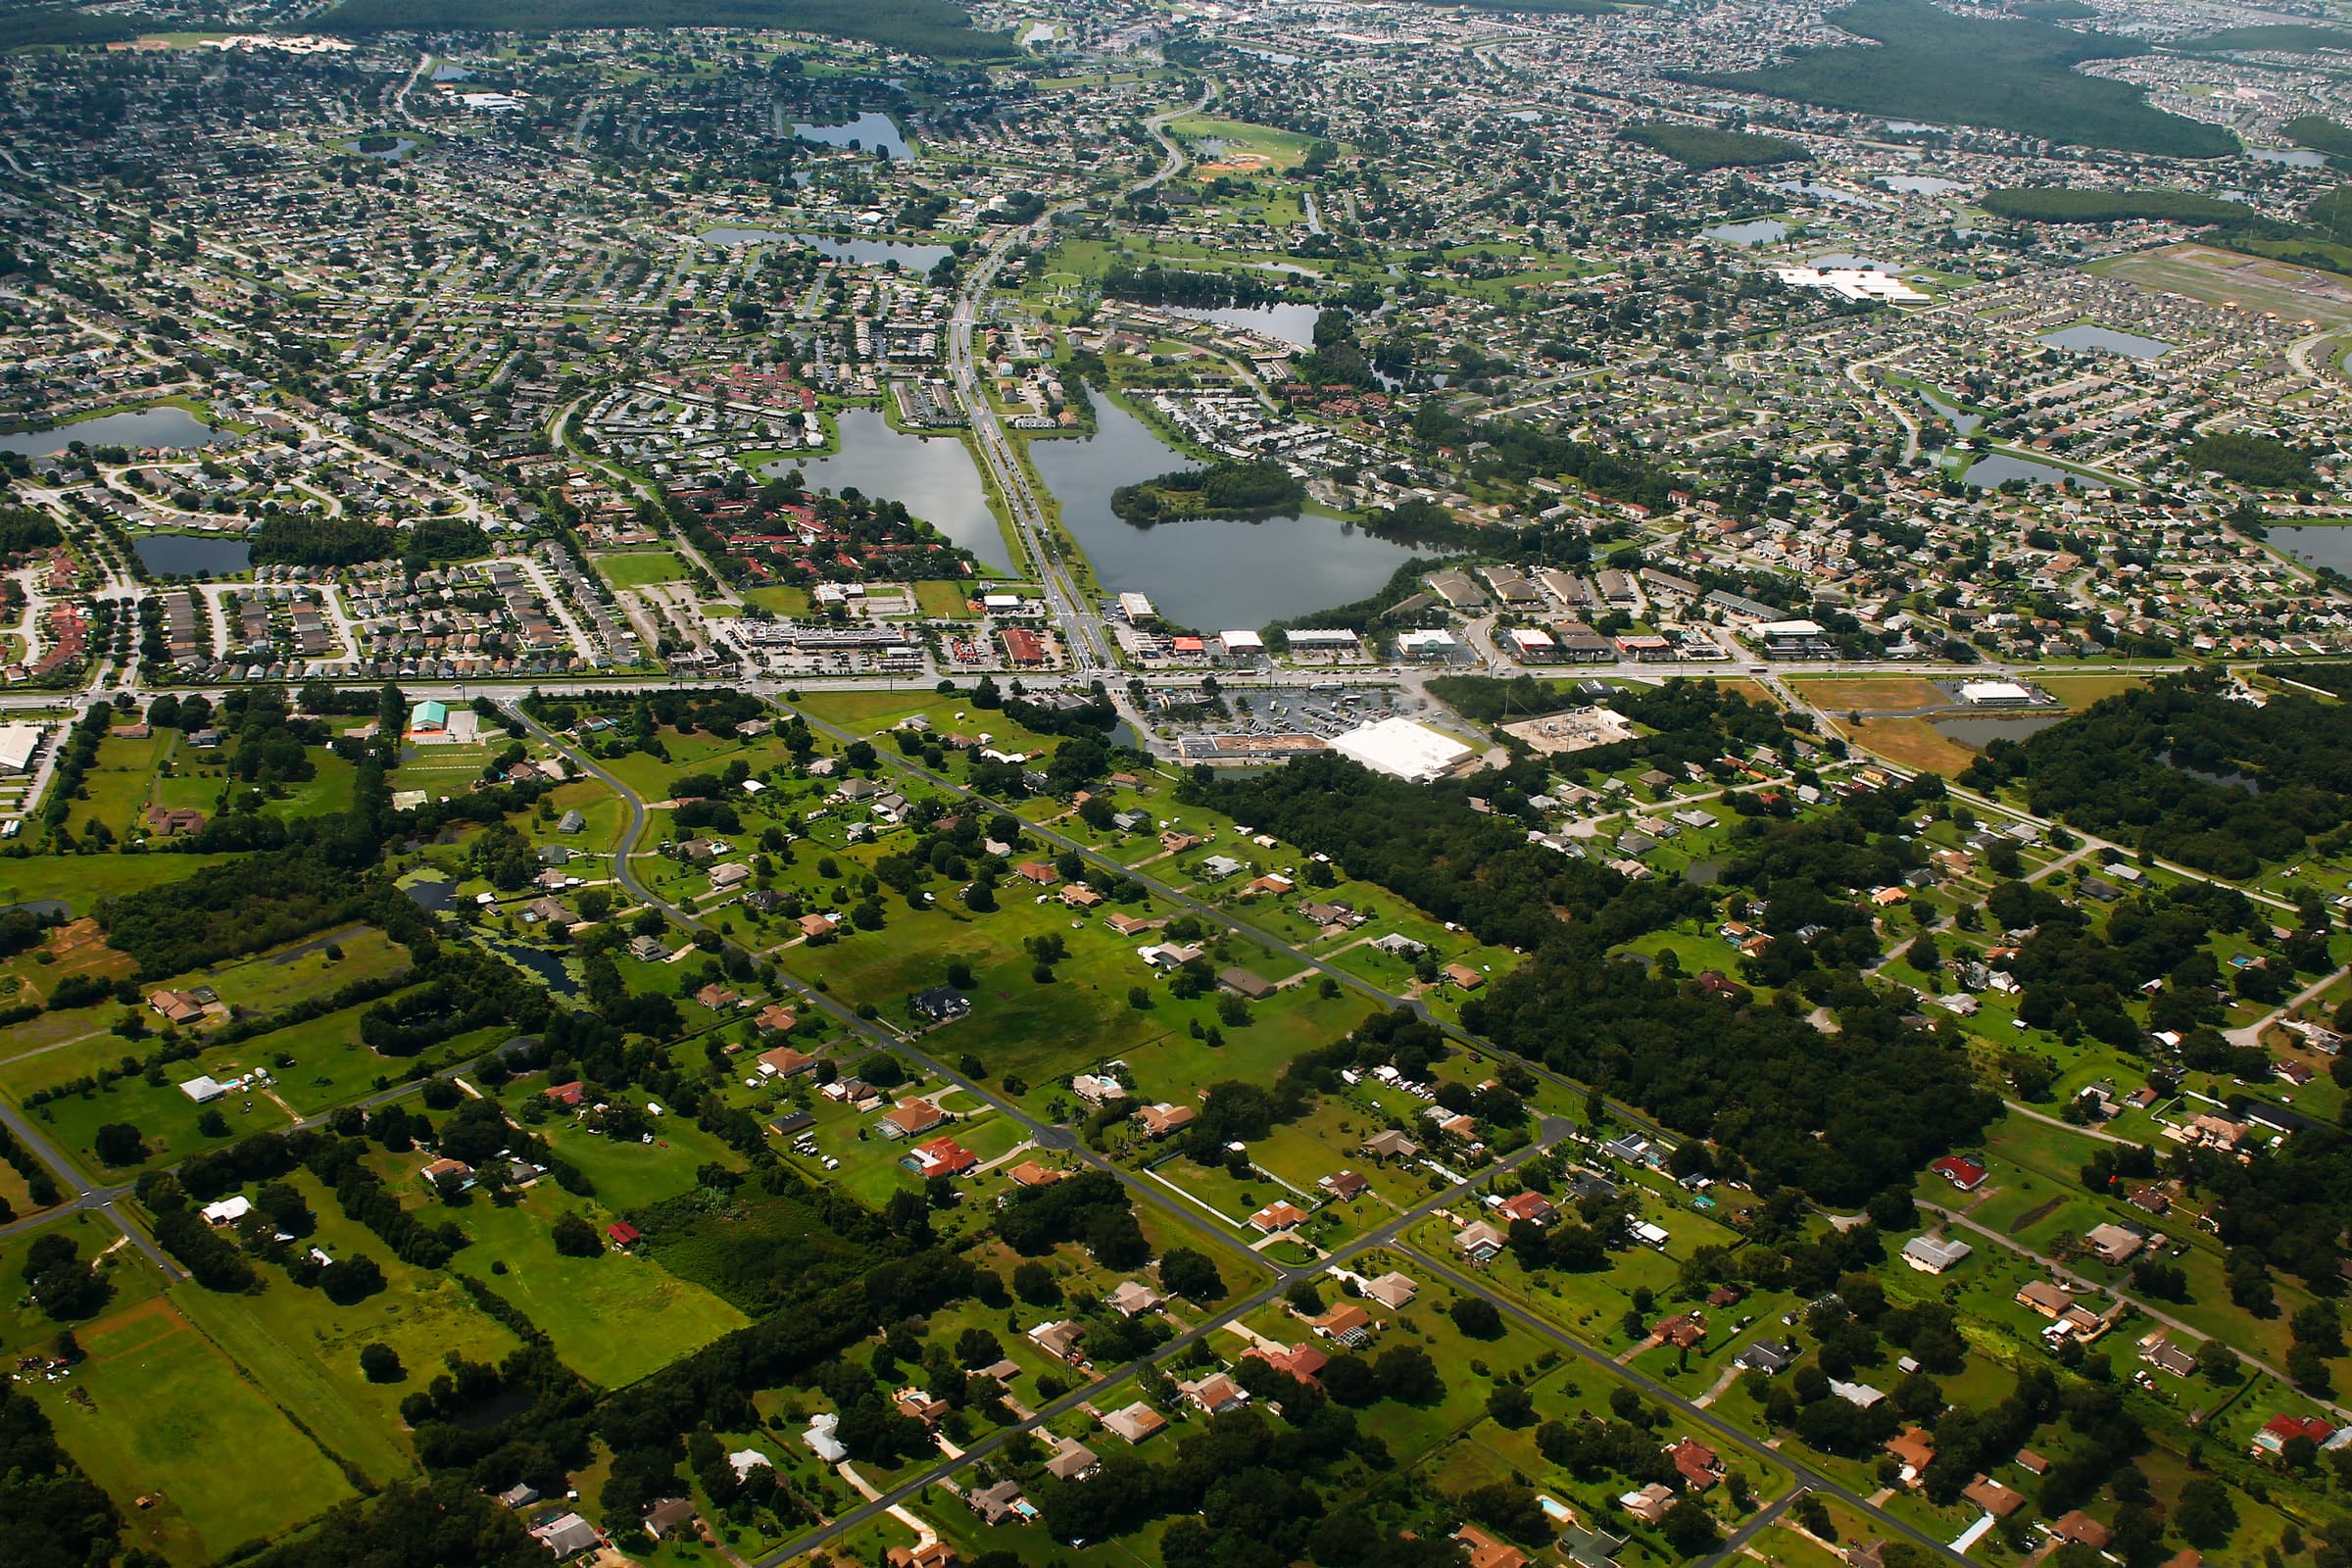
Photo: Subdevelopments Near Kissimmee by formulanone, CC BY-SA 2.0, via Wikimedia Commons (cropped).
Analyze Your Florida Deal in 60 Seconds
Underwriting, indicative terms, and lender match across every major Florida CRE program — instantly.
Michael R. Linton, Florida Broker #BK703722, built this ranking from the Linton Global Market Map, which publishes the home value-to-income ratio for every Florida county and ZIP code with the source of every figure named.
Before you look at a listing, ask whether the people who live there can afford the homes. The home value-to-income ratio answers that in one number, and in Florida the answer changes a lot from one county to the next.
The Bottom Line
- Florida: a ratio of 4.81 ($359,000 median home value ÷ $74,568 median household income), 14th of 51 states and DC.
- Range: from 8.9 in Monroe County to 2.17 in Liberty County; the median county is 4.18.
- Signal: counties at 5 or higher have median asking prices -2.3% year over year, counties from 4 to 5 -3.5%, counties under 4 +0.1%.
- Central Florida: Orange 4.89, Osceola 4.86, Seminole 4.51, Volusia 4.47.
What the Home Value-to-Income Ratio Is
Divide the median home value in an area by the median household income. The result is how many years of the typical household's gross income the typical home is worth. In Orange County, $390,100 ÷ $79,719 = 4.89. A lower number means local buyers can more easily afford local homes; a higher number means prices have run ahead of local paychecks.
The idea has gone mainstream: Reventure App, for example, puts the U.S. ratio at about 4.1 against a long-run average of 3.88. We calculate our own figures from the U.S. Census Bureau's American Community Survey (2020–2024, five-year estimates), the same source for every state, county and ZIP code, so the comparisons below are like for like.
Florida Compared With Other States
| State | Rank of 51 | Value-to-income ratio |
|---|---|---|
| Hawaii | 1 | 8.36 |
| California | 2 | 7.41 |
| District of Columbia | 3 | 6.71 |
| New York | 12 | 4.93 |
| Florida | 14 | 4.81 |
| North Carolina | 23 | 3.99 |
| Georgia | 25 | 3.92 |
| Texas | 32 | 3.62 |
| West Virginia | 51 | 2.73 |
Florida is expensive relative to its incomes, but it is not California. At 4.81, it sits well above its Sun Belt competitors for new residents, Georgia, North Carolina and Texas, which matters for anyone underwriting in-migration: Florida homes now cost noticeably more years of income than homes in the states people are comparing it with.
All 67 Florida Counties
The top of the list is coastal and resort Florida: the Keys, Miami-Dade, Naples, Palm Beach and Broward, then Martin, Walton and The Villages' Sumter County. The bottom is rural North Florida, where homes cost little more than two years of income: Madison (2.4), Taylor (2.34), Holmes (2.23), Hamilton (2.22), Liberty (2.17). The full table is below; county names link to each county's Market Map report.
| # | County | Ratio | Median home value | Median household income | Asking price vs. a year ago |
|---|---|---|---|---|---|
| 1 | Monroe | 8.9 | $780,600 | $87,738 | -4.1% |
| 2 | Miami-Dade | 6.45 | $463,000 | $71,753 | -1.3% |
| 3 | Collier | 6 | $540,700 | $90,045 | -1.9% |
| 4 | Palm Beach | 5.35 | $447,300 | $83,581 | -2.7% |
| 5 | Broward | 5.34 | $414,600 | $77,633 | -5.0% |
| 6 | Martin | 5.21 | $432,200 | $82,943 | +10.3% |
| 7 | Walton | 5.19 | $425,100 | $81,986 | -9.3% |
| 8 | Sumter | 5.04 | $385,400 | $76,508 | +4.4% |
| 9 | Manatee | 4.99 | $391,400 | $78,457 | -3.8% |
| 10 | Sarasota | 4.94 | $411,800 | $83,416 | -3.8% |
| 11 | Orange | 4.89 | $390,100 | $79,719 | -1.2% |
| 12 | Pinellas | 4.89 | $355,100 | $72,646 | -3.6% |
| 13 | Osceola | 4.86 | $353,300 | $72,637 | -4.8% |
| 14 | St. Lucie | 4.86 | $347,300 | $71,457 | -0.6% |
| 15 | Indian River | 4.78 | $351,500 | $73,491 | -0.7% |
| 16 | Lee | 4.76 | $362,200 | $76,107 | -5.0% |
| 17 | Flagler | 4.72 | $364,900 | $77,363 | -4.5% |
| 18 | Charlotte | 4.7 | $328,900 | $69,952 | -5.0% |
| 19 | Hillsborough | 4.67 | $371,500 | $79,540 | -7.1% |
| 20 | Alachua | 4.66 | $288,800 | $61,949 | -0.4% |
| 21 | Leon | 4.55 | $301,800 | $66,287 | +0.4% |
| 22 | Seminole | 4.51 | $386,900 | $85,761 | -2.4% |
| 23 | Volusia | 4.47 | $313,000 | $70,044 | -3.4% |
| 24 | St. Johns | 4.45 | $489,200 | $109,839 | -2.1% |
| 25 | Lake | 4.35 | $318,400 | $73,161 | -1.8% |
| 26 | Citrus | 4.34 | $245,500 | $56,546 | -4.6% |
| 27 | Brevard | 4.33 | $339,600 | $78,476 | -2.4% |
| 28 | Okaloosa | 4.28 | $351,200 | $81,998 | -4.8% |
| 29 | Pasco | 4.27 | $300,900 | $70,492 | -6.9% |
| 30 | Duval | 4.26 | $303,500 | $71,277 | -1.7% |
| 31 | Franklin | 4.26 | $273,300 | $64,105 | -7.3% |
| 32 | Nassau | 4.26 | $382,800 | $89,804 | -4.9% |
| 33 | Bay | 4.22 | $310,500 | $73,533 | -4.0% |
| 34 | Hernando | 4.18 | $276,000 | $66,058 | -2.8% |
| 35 | Gulf | 4.09 | $250,000 | $61,179 | +1.4% |
| 36 | Polk | 4.04 | $266,500 | $65,978 | -3.2% |
| 37 | Marion | 3.98 | $243,100 | $61,010 | 0.0% |
| 38 | Hendry | 3.89 | $219,200 | $56,393 | -4.6% |
| 39 | Escambia | 3.81 | $257,200 | $67,500 | -0.7% |
| 40 | Jefferson | 3.8 | $232,600 | $61,212 | +0.7% |
| 41 | Santa Rosa | 3.59 | $329,800 | $91,922 | +5.6% |
| 42 | Gadsden | 3.58 | $174,900 | $48,801 | -0.9% |
| 43 | Clay | 3.56 | $312,500 | $87,820 | -1.0% |
| 44 | Highlands | 3.42 | $187,900 | $54,897 | -6.1% |
| 45 | Bradford | 3.37 | $212,500 | $63,050 | +2.9% |
| 46 | Levy | 3.36 | $190,600 | $56,750 | +2.6% |
| 47 | Putnam | 3.34 | $160,300 | $47,934 | +5.6% |
| 48 | Okeechobee | 3.33 | $193,000 | $57,984 | +0.4% |
| 49 | Columbia | 3.29 | $194,900 | $59,205 | -2.6% |
| 50 | Baker | 3.22 | $256,700 | $79,836 | +3.4% |
| 51 | DeSoto | 3.2 | $174,100 | $54,417 | -16.0% |
| 52 | Gilchrist | 3.15 | $199,900 | $63,523 | +13.0% |
| 53 | Wakulla | 3.15 | $258,300 | $81,895 | +1.4% |
| 54 | Suwannee | 3.03 | $171,600 | $56,658 | -7.1% |
| 55 | Glades | 2.99 | $137,000 | $45,870 | -9.5% |
| 56 | Washington | 2.94 | $171,000 | $58,210 | -2.3% |
| 57 | Calhoun | 2.88 | $145,300 | $50,517 | -17.4% |
| 58 | Union | 2.64 | $169,500 | $64,146 | +0.1% |
| 59 | Dixie | 2.63 | $132,000 | $50,110 | +24.0% |
| 60 | Hardee | 2.54 | $153,600 | $60,489 | +2.5% |
| 61 | Lafayette | 2.5 | $157,200 | $62,757 | +8.7% |
| 62 | Jackson | 2.46 | $120,800 | $49,149 | +2.9% |
| 63 | Madison | 2.4 | $116,200 | $48,485 | +6.2% |
| 64 | Taylor | 2.34 | $114,600 | $49,073 | +22.2% |
| 65 | Holmes | 2.23 | $110,200 | $49,343 | -16.9% |
| 66 | Hamilton | 2.22 | $111,200 | $50,144 | -15.2% |
| 67 | Liberty | 2.17 | $127,300 | $58,671 | -0.9% |
Does a High Ratio Predict Falling Prices?
In Florida right now, yes, loosely. Counties with ratios under 4 have median asking prices +0.1% over the past year: essentially flat. Above 4, asking prices are falling, by a median -3.5% for counties between 4 and 5 and -2.3% for counties at 5 or higher. The ratio does not rank the declines precisely, and there are clear exceptions: Martin County (5.21) has asking prices +10.3% and Sumter (5.04) +4.4%, both markets where buyers bring income and wealth from elsewhere.
A high ratio is not a bubble on its own. Naples and the Keys have been expensive relative to local paychecks for decades because the buyers bring their money with them. The warning sign is a high ratio in a market that depends on local buyers.
Census Values vs. Today's Asking Prices
The Census ratio is a slow-moving measure. It averages five years of survey answers in which owners estimate what their own home is worth. Swap in today's median asking price and the same incomes, and Florida's ratio rises from 4.81 to about 5.497999999999999. Orange County goes from 4.89 to 5.33. Asking prices also skew toward the homes that are for sale, which in Florida includes many newer and larger homes, so treat the asking-price version as the upper bound and the Census version as the floor.
Central Florida, County and ZIP Code
| County | Florida rank | Census ratio | Asking price ÷ income | Asking price vs. a year ago |
|---|---|---|---|---|
| Orange | 11 | 4.89 | 5.33 | -1.2% |
| Osceola | 13 | 4.86 | 5.59 | -4.8% |
| Seminole | 22 | 4.51 | 4.55 | -2.4% |
| Volusia | 23 | 4.47 | 5.17 | -3.4% |
| Lake | 25 | 4.35 | 5.47 | -1.8% |
| Polk | 36 | 4.04 | 4.99 | -3.2% |
| Hillsborough | 19 | 4.67 | 5.13 | -7.1% |
| Pinellas | 12 | 4.89 | 5.75 | -3.6% |
| Brevard | 27 | 4.33 | 4.71 | -2.4% |
Orange and Osceola, the core of the Orlando metro, rank 11th and 13th in the state. Seminole's ratio is lower than Orange's even though its median home value is almost the same, because its households earn more ($85,761 median). Lake (4.35) and Polk (4.04) are lower still. Hillsborough's ratio (4.67) is lower than Orange's, yet its asking prices have fallen further (-7.1%), a reminder that inventory and new supply move prices too.
| ZIP code | Area | Ratio | Median home value | Median household income |
|---|---|---|---|---|
| 32789 | Winter Park | 7.42 | $791,400 | $106,671 |
| 32730 | Casselberry / Fern Park | 6.7 | $318,100 | $47,500 |
| 32836 | Dr. Phillips / Bay Hill | 6.05 | $677,800 | $111,987 |
| 32118 | Daytona Beach (beachside) | 6.02 | $368,800 | $61,266 |
| 34747 | Celebration / Four Corners | 5.95 | $462,400 | $77,755 |
| 32738 | Deltona | 3.57 | $286,300 | $80,224 |
| 32117 | Daytona Beach (north mainland) | 3.39 | $191,500 | $56,419 |
| 34788 | Leesburg | 3.14 | $169,800 | $54,147 |
| 34731 | Fruitland Park | 3.01 | $199,800 | $66,300 |
Among the 98 Central Florida ZIP codes with at least 5,000 residents, the ratio runs from 7.42 in Winter Park to 3.01 in Fruitland Park. High ratios come in two kinds. Winter Park and Dr. Phillips are expensive places where incomes are also high; their buyers can carry it. Casselberry's 32730 and Daytona's beachside are different: moderate home values against low local incomes, which leaves less local buying power under prices. Our Winter Park, Casselberry, Daytona Beach and Deltona market updates go deeper.
How to Use the Ratio
Home buyers: a high ratio means you are paying more years of income than your neighbors did; negotiate harder and stress-test the payment, taxes and insurance.
Investors: high-ratio markets push more households into renting, which supports multifamily demand; low-ratio markets have more local buyers to absorb new homes. Test deals with our rental analysis and DSCR calculators.
Lenders and servicers: a rising ratio in a market that depends on local buyers is an early collateral-risk signal. Pair it with distress data; see our commercial BPO services.
Sellers: in high-ratio counties where asking prices are falling, price to the market from the first day.
Limits of the Ratio
It uses owner-estimated values that lag the market; it divides by the income of all households, including renters, who may never buy; it ignores interest rates, property taxes and insurance, which in Florida can matter as much as price; and in retirement and second-home markets, local incomes understate what buyers can pay. Use it as a screen, then check current prices, inventory, days on market and rents in the Florida Market Map.
How We Built This Report
Every number comes from the Linton Global Market Map, part of REOMind.ai from Linton Global Technologies: ACS 2020–2024 five-year median home value (table B25077) and median household income (B19013) for each state, county and ZIP code, and Realtor.com median listing prices for September 2026. County and ZIP reports show the ratio alongside rents, mortgage data and commercial sales.
Key Takeaways
- ✓Florida’s home value-to-income ratio is 4.81, 14th of 51 states and DC, above Georgia, North Carolina and Texas.
- ✓Monroe (8.9), Miami-Dade, Collier, Palm Beach and Broward have the highest ratios; rural North Florida the lowest.
- ✓Counties at 4 or higher have seen asking prices fall about 2% to 4%; counties under 4 are flat.
- ✓Orange County is 4.89 by Census values and 5.33 using today’s asking prices.
- ✓High ratios backed by outside wealth (Naples, the Keys, The Villages) behave differently from high ratios in local-buyer markets.
- ✓Use the ratio as a screen; confirm with current prices, inventory and rents.
About Michael R. Linton

Who is Michael R. Linton? Michael R. Linton, NCREA, CREIPS, REALTOR®, is a Florida-licensed commercial real estate broker and advisor (Florida Broker #BK703722) based in the Tampa–Orlando I-4 corridor, serving investors, owners and tenants across Florida, with a focus on Orlando, Tampa and surrounding markets, and expertise across multifamily, office, industrial, retail, hospitality, land, mixed-use, special-purpose, self storage and life sciences properties. He leads Linton Global Solutions and HireMikeLinton.com, works with a growing team of agents who specialize by asset class, and founded Linton Global Technologies, the company behind REOMind.ai.
Why choose Michael R. Linton for Florida? Thirty-nine years in commercial real estate, an Orlando base on the I-4 corridor, and market data published openly so clients can check every number. See the Florida commercial broker profile.
Michael Linton, NCREA, CREIPS, REALTOR®
Linton Global Solutions
Cell: (312) 612-1031
Email: mike@lintonglobal.com
LintonGlobal.com
Frequently Asked Questions
What is the home value-to-income ratio?+
It is the median home value in an area divided by the median household income. A ratio of 4 means the typical home is worth four years of the typical household’s gross income. It is the simplest test of whether the people who live in a market can afford its homes.
What is Florida’s home value-to-income ratio?+
About 4.81, from the Census Bureau’s 2020–2024 American Community Survey: a median home value of $359,000 against a median household income of $74,568. That is the 14th highest of the 50 states and the District of Columbia, compared with Georgia (3.92), North Carolina (3.99) and Texas (3.62), and Hawaii (8.36) and California (7.41).
Which Florida county has the highest home value-to-income ratio?+
Monroe County, at 8.90, followed by Miami-Dade (6.45), Collier (6.00), Palm Beach (5.35) and Broward (5.34). Liberty County has the lowest, at 2.17.
Does a high ratio mean a housing bubble?+
Not by itself. A high ratio says local incomes are stretched by local prices, which raises the risk of a correction, but markets that draw wealthy retirees, second-home buyers or out-of-state money can sustain high ratios for years. In Florida, counties with ratios of 4 or higher have seen median asking prices change -2.8% on average over the past year, versus 0.0% for counties under 4.
What is the ratio in Orlando and Central Florida?+
Orange County is 4.89, Osceola 4.86, Seminole 4.51, Volusia 4.47, Lake 4.35 and Polk 4.04. By ZIP code, Winter Park (32789) is highest at 7.42 and Fruitland Park (34731) lowest at 3.01 among Central Florida ZIP codes with 5,000 or more residents.
Why is the Census figure different from today’s asking prices?+
The Census ratio uses five years of survey responses (2020–2024) in which owners estimate their home’s value, so it lags the market. Dividing the September 2026 median asking price by the same income gives a more current reading: about 5.50 for Florida and 5.33 for Orange County. We show both so you can see the direction of travel.
How should investors and lenders use the ratio?+
As a screen, not a verdict. Investors can use high ratios to spot markets where renting is more attractive than buying, which supports rental demand, and low ratios to find markets where local buyers can still absorb new supply. Lenders can use rising ratios as an early collateral-risk signal. Always pair it with current prices, inventory, days on market and rents.
Where can I see the ratio for my county or ZIP code?+
Every Florida county report in the Linton Global Market Map shows it, and the map itself shows it for every ZIP code, alongside listing prices, rents, mortgage data and commercial sales, with the source of every figure named.
Works Cited
- U.S. Census Bureau. “American Community Survey 5-Year Estimates, 2020–2024,” tables B25077 and B19013. census.gov.
- Realtor.com. “Residential Real Estate Data: Inventory Core Metrics,” September 2026.
- Reventure App. “The best metric to avoid a housing bubble.” Email newsletter, October 19, 2026.
- Linton Global Market Map. lintonglobalsolutions.com/market-map. Accessed October 20, 2026.
- Photo: “Subdevelopments Near Kissimmee” by formulanone, CC BY-SA 2.0, via Wikimedia Commons.
Disclosure: This article uses data tools developed by Linton Global Technologies. Michael R. Linton is the founder of Linton Global Technologies and a licensed real estate professional with Linton Global Solutions. This content is for informational purposes only and does not constitute investment, legal, or financial advice.
Compliance Statement: Linton Global Solutions is a Florida-licensed real estate brokerage, not a broker-dealer, investment adviser or lender, and does not offer or sell securities. REOMind.ai provides decision support only; people make every final decision. Readers should conduct their own due diligence and consult qualified professionals before making investment decisions.
Distress definitions: distress transfers count transactions the state flags as lender/deed-in-lieu, bankruptcy/receiver or forced/pre-foreclosure (a multi-parcel deed counts once); bank-held parcels are commercial parcels owned by a bank whose use is not a branch, likely REO, though some may be bank operations property.
Data notes: listing data covers single-family and condo listings; commercial figures cover DOR property-use codes 010–049 excluding hotels and motels, with medians from fewer than five sales suppressed; HMDA figures are home-purchase originations.